


You may know this feeling: Oil prices tick up, and the six-foot price at your local gas station changes before you can blink. But when the price of oil starts to fall, the relief seems to arrive in slow motion.
It’s not your imagination. Economists have documented this pattern for decades. Gas prices have a habit of rising like rockets, while falling like feathers.
And this phenomenon is making news right now.
Oil prices have been bouncing around since the start of the Iran war, but now that prices have started to decline following the (on-again, off-again) ceasefire, Donald Trump has jumped on social media to accuse oil companies of not cutting gasoline prices fast enough.
He even called it price gouging:
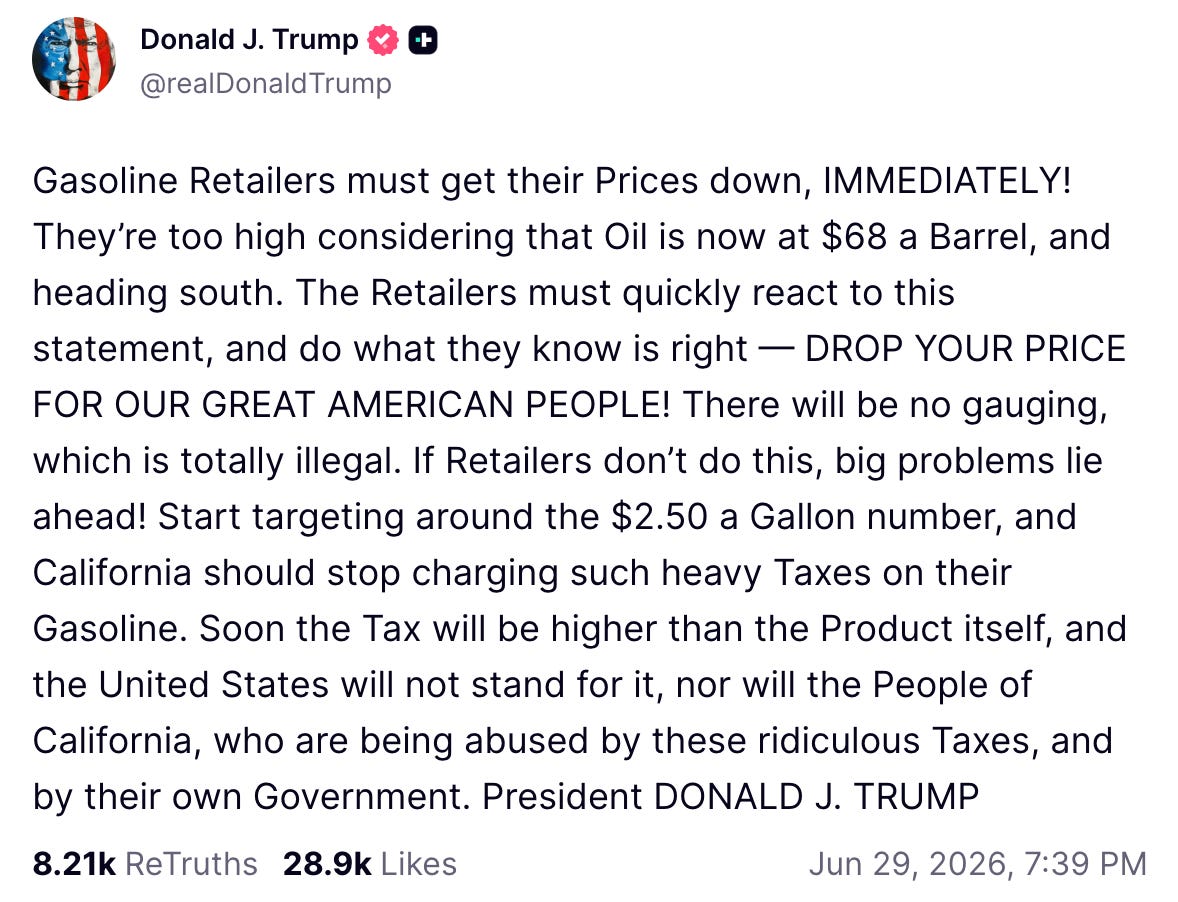
Price gouging is a serious charge. So before we press charges, let’s attempt to better understand what’s actually going on here.
The asymmetric pattern of “rockets and feathers” doesn’t necessarily prove wrongdoing on the part of oil companies or gas stations. Instead, it can emerge from several different mechanisms—some innocent and others more troubling. But either way, understanding this pattern (and its causes) can help you make smarter decisions for your own wallet.
Gas prices jump, then drift
Let’s start with the actual claim: It’s not that gas prices never fall. Of course they do. Instead, it’s a claim about the speed at which they do.
Which means this isn’t necessarily a question about good blokes versus bad blokes, but one of timing: Does bad news travel through the system faster than good news?
This is a hypothesis we can test.
What the data show
To do so, I fetched weekly oil and gas prices as far back as the data (easily) allowed.
The gas prices come from the U.S. Energy Information Administration (or EIA), and reflect the retail price surveyed at the pump first thing every Monday. The weekly oil prices reflect the closing price of West Texas Intermediate crude oil from the previous Friday.
I compared each of these Monday pump prices to the previous Friday’s crude oil price, and as you can see below: the two track each other pretty closely.
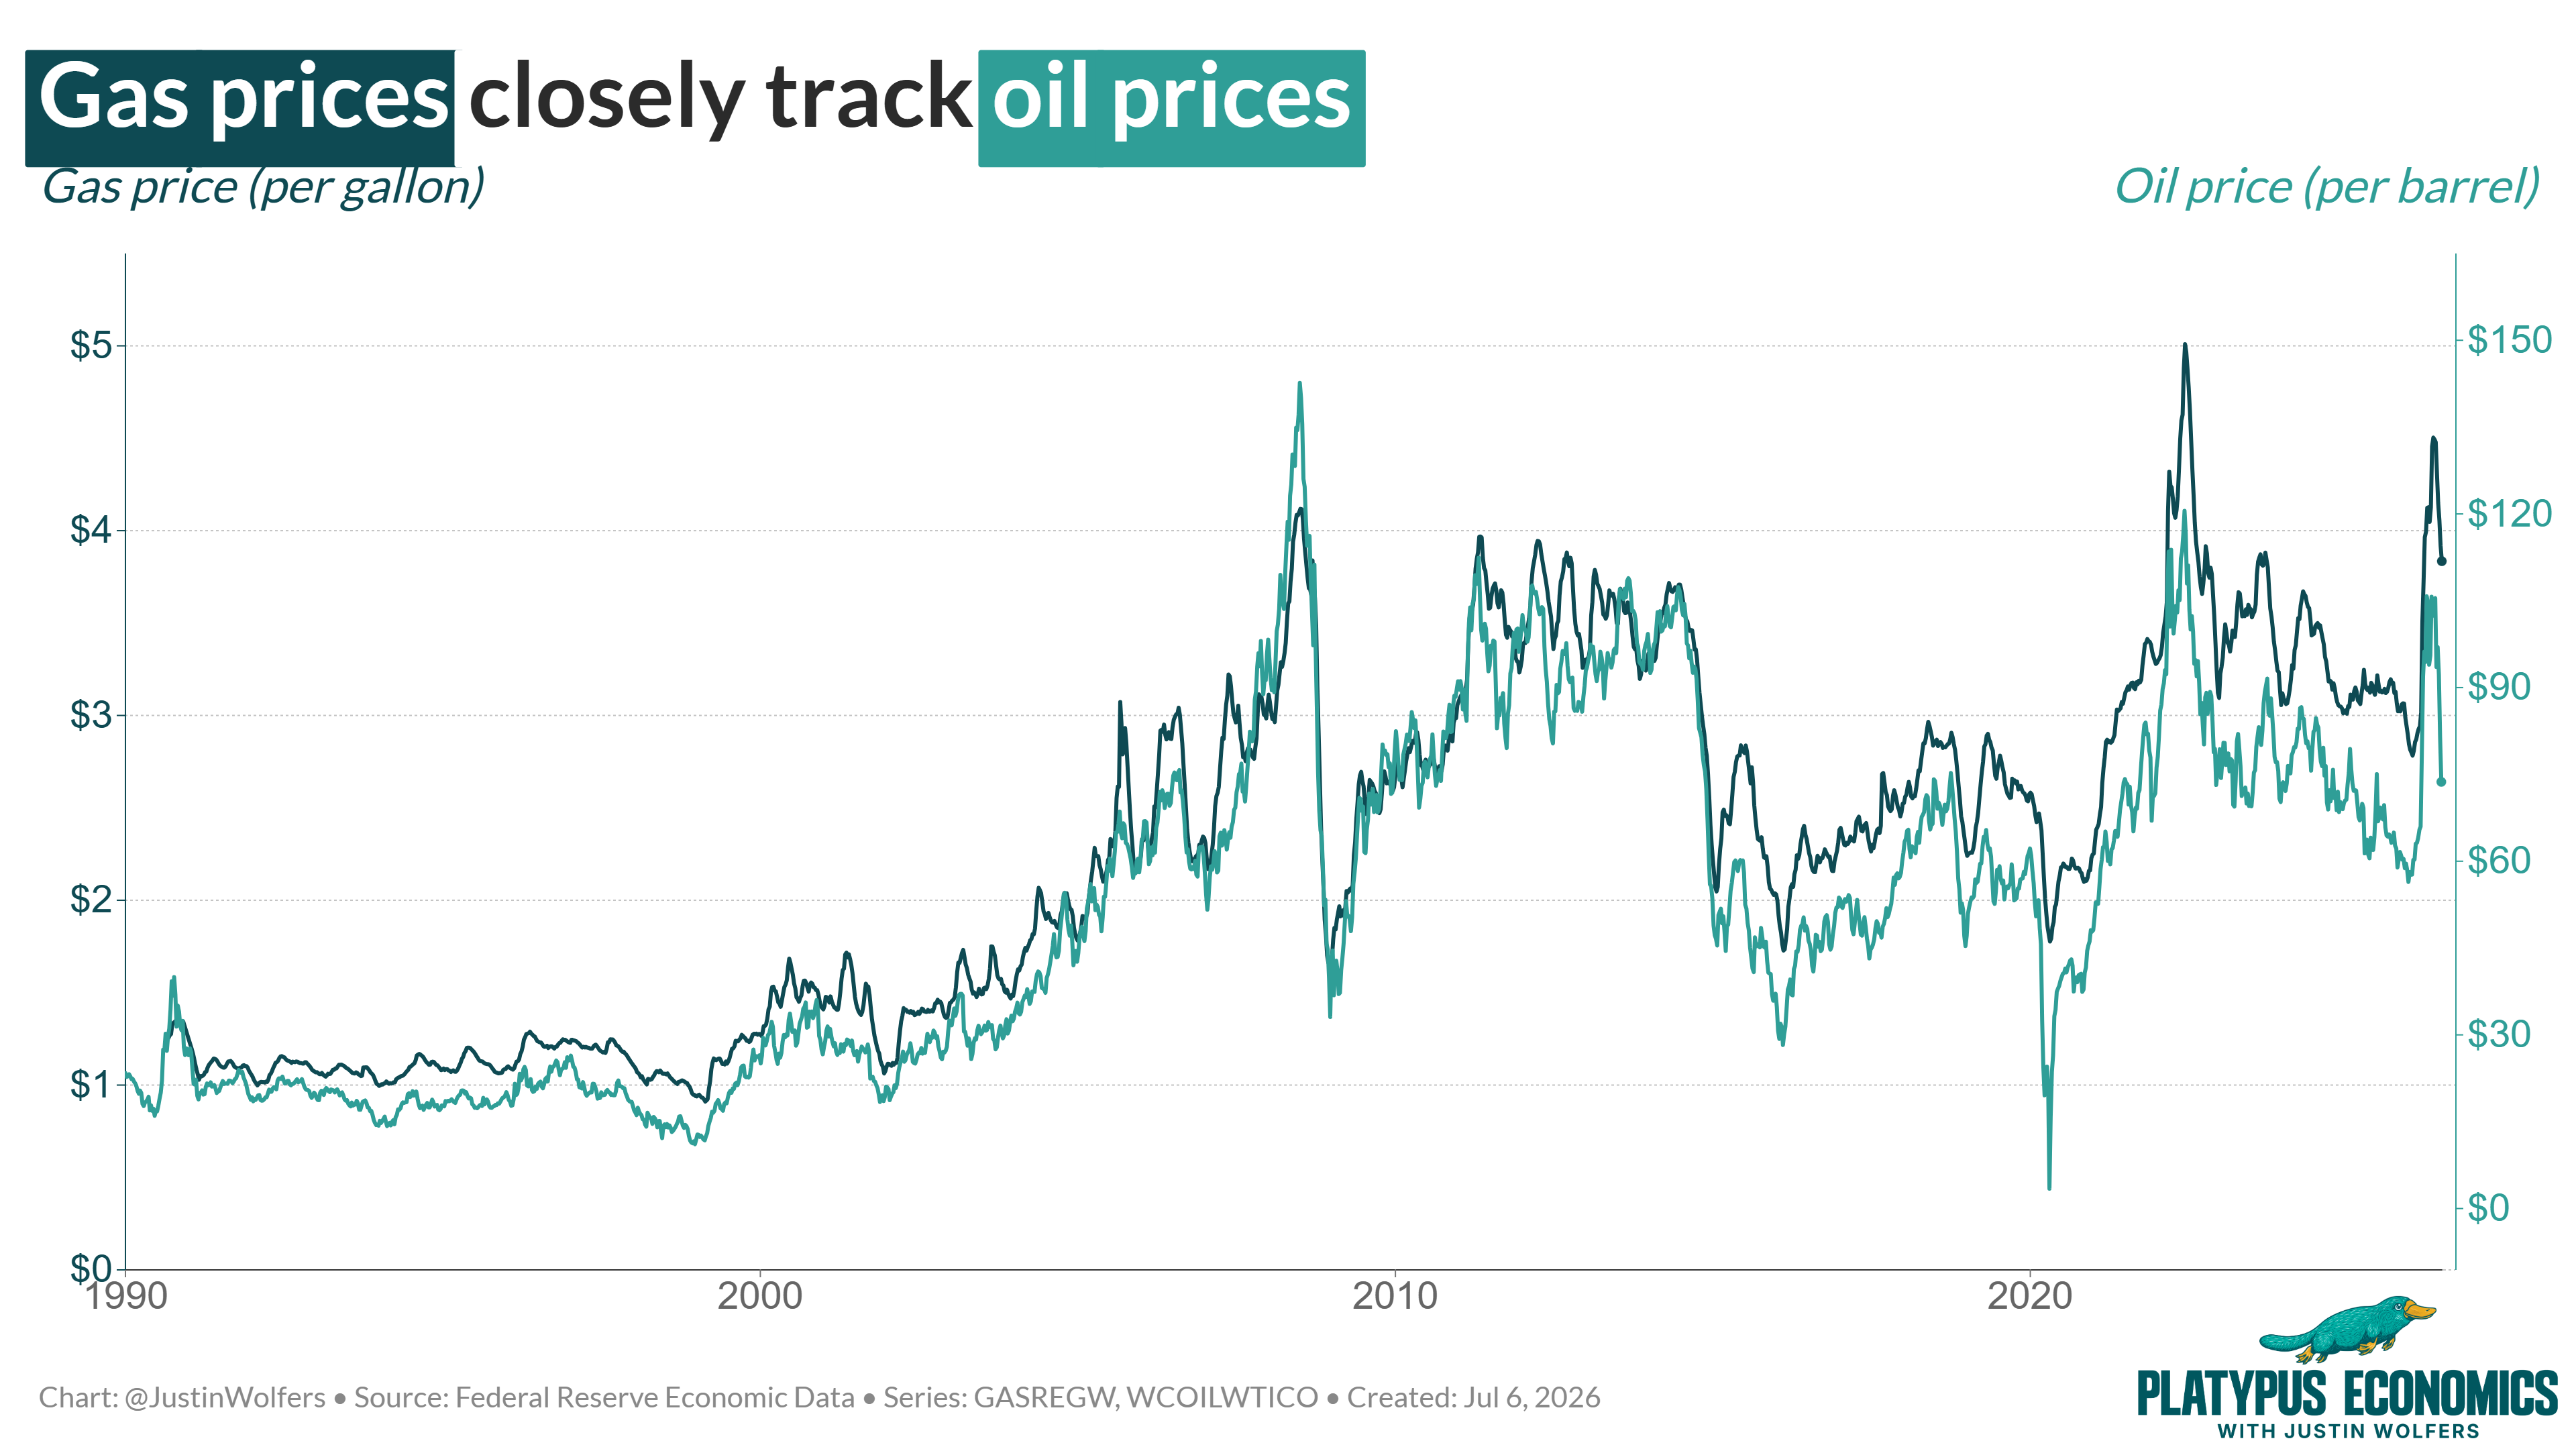
Next, I separated the weeks when the price of crude oil rose from those when it fell, and used Stata to figure out how much these different movements showed up in retail gas prices over the following eight weeks. (See the very bottom of this post for a few more details.)
Here’s what I found: When the price of crude oil rises, the price of gasoline catches up really quickly. Most of the movement lands within a week or two.
But when the price of crude oil falls, the relief shows much more slowly, dribbling in over the following weeks.
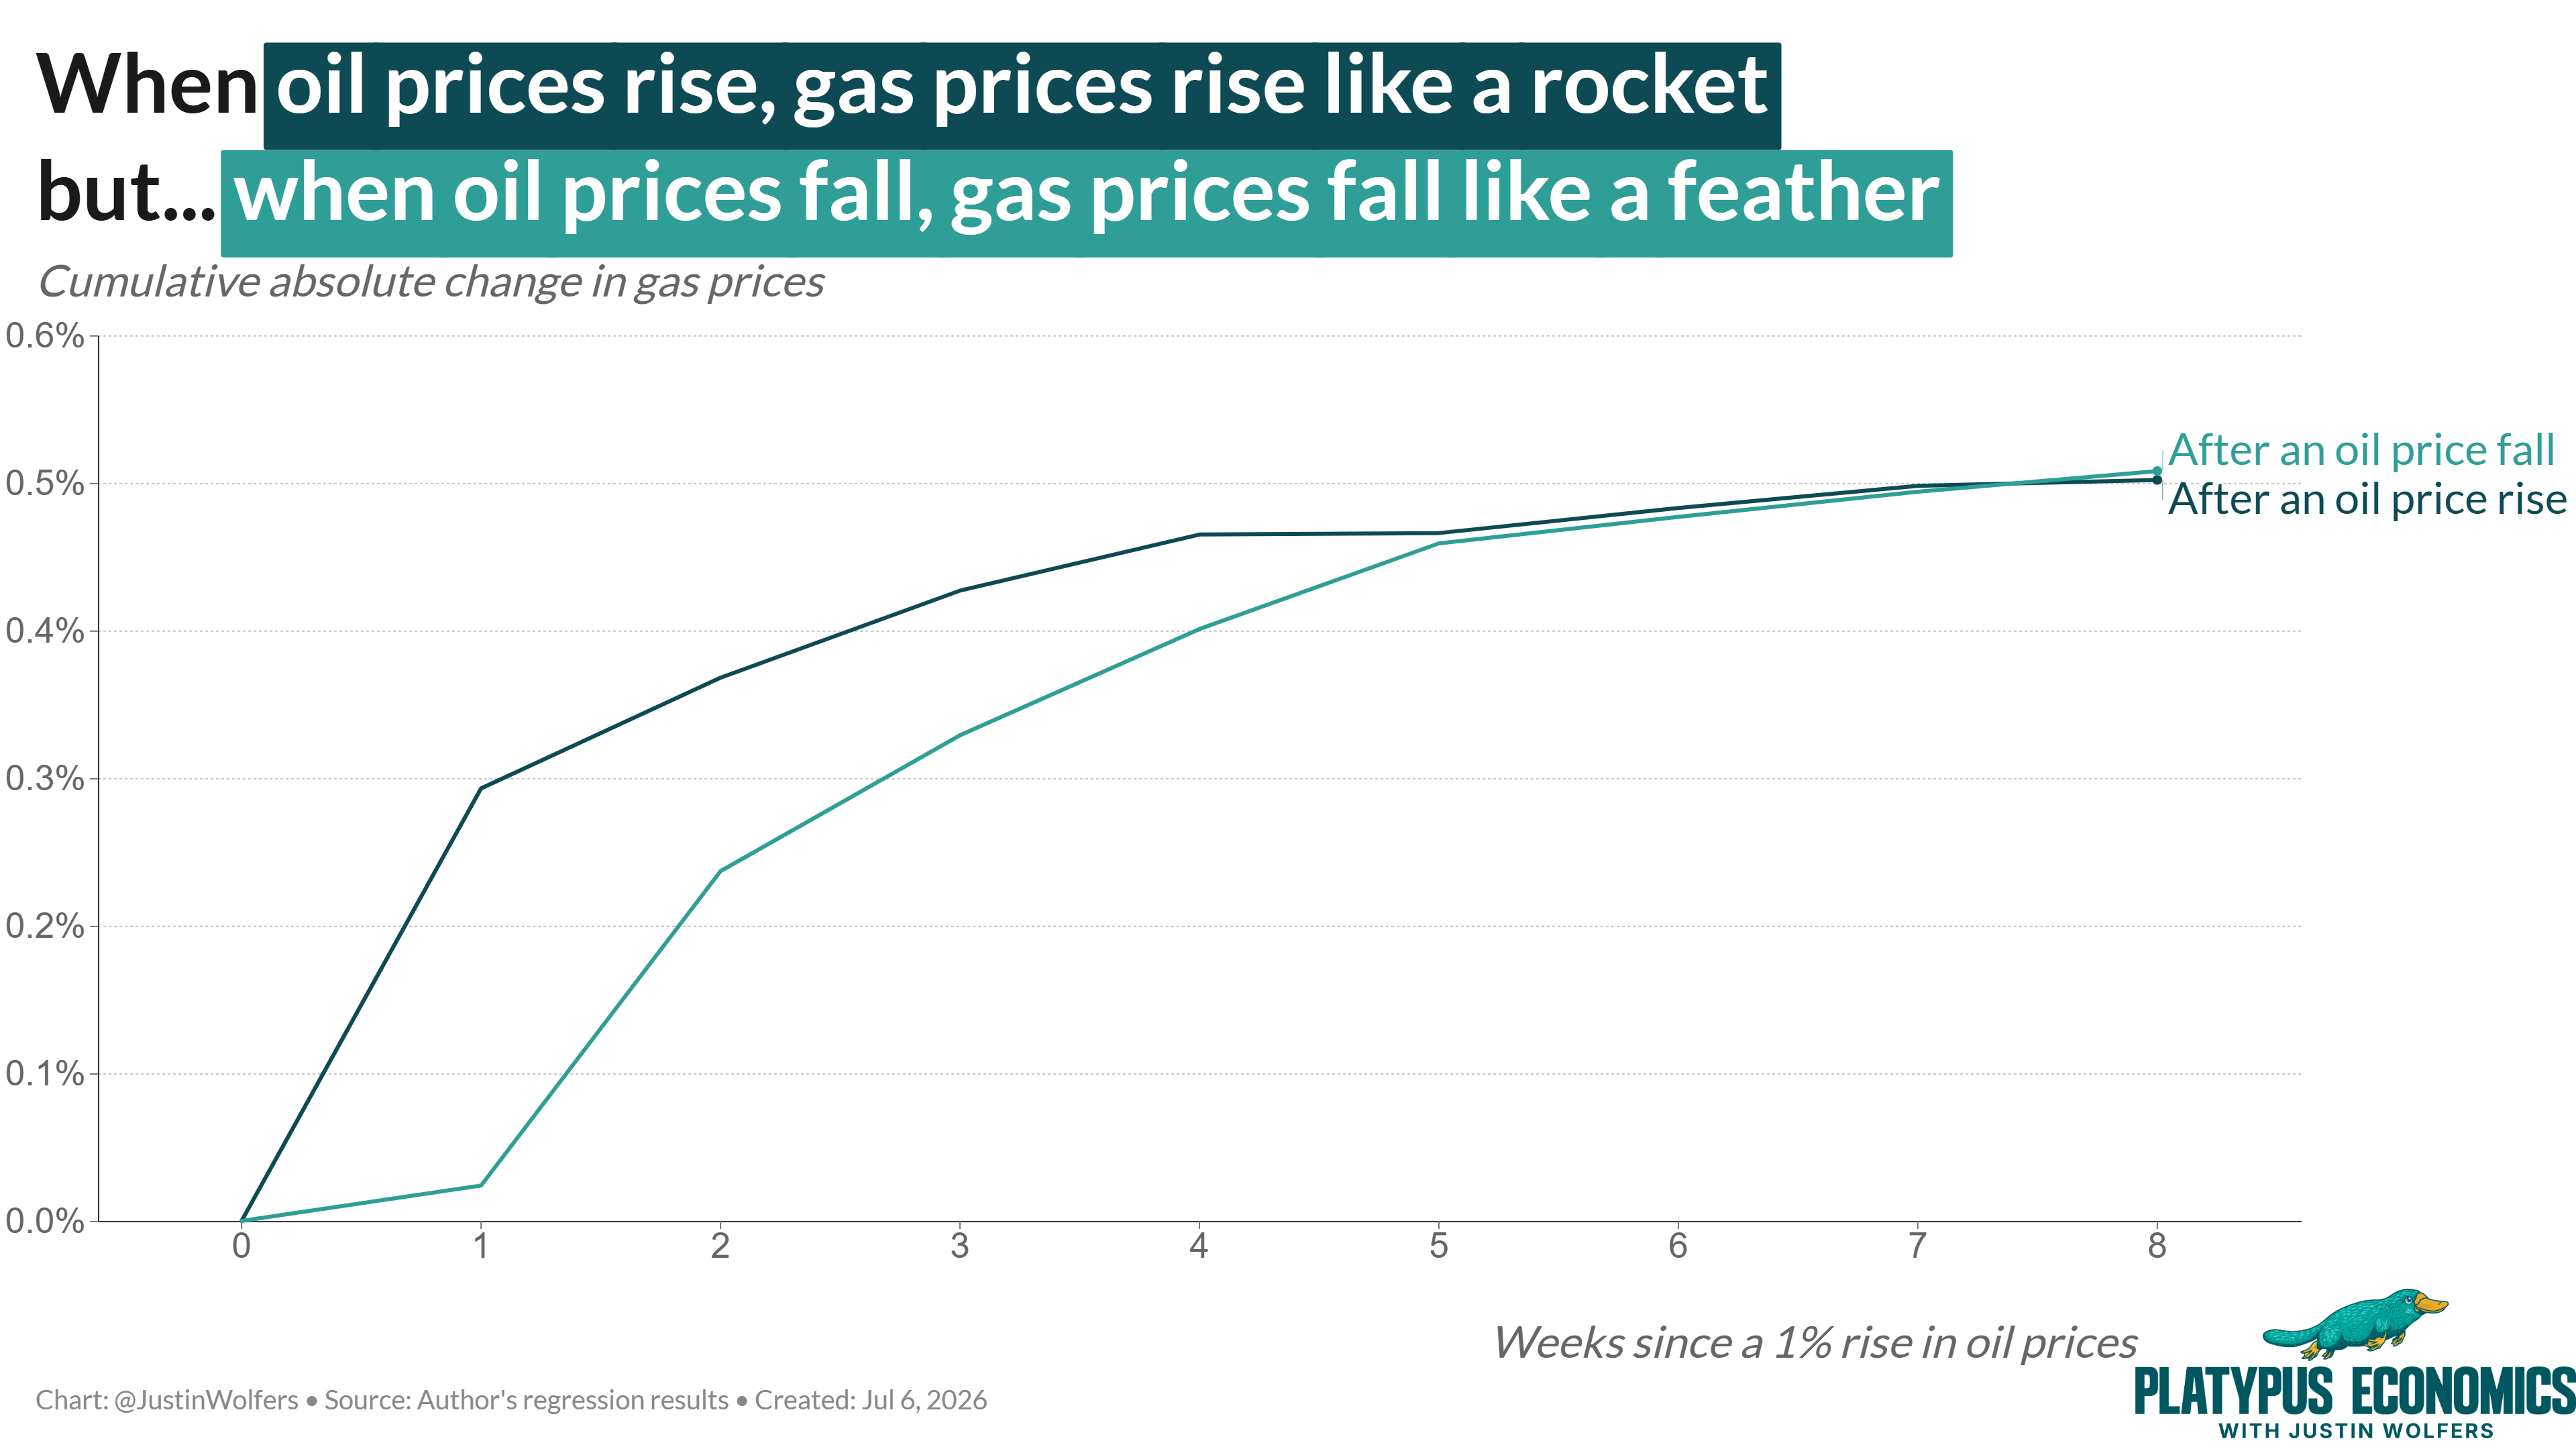
In other words, the data prove the pattern we suspected: gas prices respond to oil price changes asymmetrically: They rise like a rocket and fall like a feather.
But give it a couple of months, and the two roughly even out. Eventually, the feather does land. Which means the asymmetry is almost entirely about speed. No-one is pocketing an extra big profit margin for more than a few weeks.
Why the pattern exists
Now that we know this pattern exists, the next question is much harder to answer: why does it exist?
There are several possible mechanisms, each of which can produce the same broad pattern:
Cause #1: Consumer Search Habits
An unchanged price (even if it’s high and too high given the state of oils prices) tends to generate a lot less attention than one that’s actively increasing.
So even when the price of crude oil has fallen and gas prices really ought to be lower, most people don’t know what the correct lower price should be and will keep buying from the same station they bought from the previous week.
Because of this tendency for consumers to search less aggressively when prices are falling, stations can lower their prices slowly without losing many customers. This isn’t a conspiracy, or even price gouging. Instead, it’s the result of imperfect information, costly search processes, and a bit of human psychology.
Cause #2: Tacit Collusion
The second mechanism is one that many people—including the president—suspect straight away. It’s called tacit collusion.
The collusion part is when competing gas stations each agree to keep their prices high. That’s illegal. But it can work without competitors meeting up in smoky alleys to agree to squeeze their customers rather than each other. Instead, they can just watch each other. (This is particularly easy with gas stations, whose prices are prominently displayed for all to see.)

When the price of crude oil starts falling, each gas station faces the same awkward question: should I cut my prices or not?
On the one hand, cutting prices could give them a competitive advantage. But the bloke across the street is going to see that change immediately and respond in kind. Which means cutting prices will reduce a station’s profit margin, without helping them gain much extra business.
Thus, there’s a strong incentive for neighboring stations to simply wait and watch the other’s move—making them slow to move their prices on the way down.
The president would be right to call this a form of price gouging; however, the safer textbook term is tacit strategic interaction. It’s not an explicit cartel, but the firms watch each other, and know they’re being watched by others, and the implied threat that lower prices will be met with lower prices is enough that they’re each most comfortable keeping their prices a bit too high for a bit too long. Over time though, competitive forces bite, one of them blinks and cuts their price, and the feather begins its slow descent.
Cause #3: Asymmetries Elsewhere in the Supply Chain
There’s a third mechanism. Gas stations and their customers aren’t the only actors here. Gas comes from a long and complex supply chain, and perhaps that’s the source of the rockets-and-feathers asymmetry.
To make gasoline, crude oil needs to be refined and blended and shipped and stored and delivered. And at each step, firms aren’t just responding to today’s oil price, but also to the cost of ramping up production, storing inventory, and a number of both forward- and backward-looking decisions, each of which may create their own asymmetries.
Moreover, if competition is weak at any point along that chain, there’s plenty of room for the decline in oil prices to dribble through slowly to the number you see at the pump.
What this does—and doesn’t—tell you
Here’s the thing: just because we know this pattern exists—and we know some possible mechanisms—doesn’t mean we can pinpoint which mechanism (or combination of mechanisms) is responsible.
However, there are two main lessons you should take away from this:
First: Don’t overreact to a short-run mismatch.
If the price of oil fell yesterday but your local gas station hasn’t yet moved their prices, that doesn’t necessarily mean they’re trying to rob you blind. There are several mechanisms at play that could be contributing to their slow reaction, some of which lie beyond their control.
But second: Know when information matters.
When oil prices are rising, there’s often not much you can do—bad news hits the market fast. By the time you’ve learned that oil prices are moving, the six foot price at your local station has probably already risen.
But when prices are falling, stations don’t usually adjust at the same speed. Which means that’s when it’s worth checking a gas price app like GasBuddy, or shopping around a bit more carefully.
You’re not going to completely outsmart the market. But understanding the rockets and feathers pattern points you toward the moments when paying greater attention can yield bigger savings.
It’s not magic, but it’s useful economics. And hopefully, it makes the world stop looking so random, and start making a little more sense.
One more thing (for the stats nerds and stat-curious)
This post, like many, involved a bit of number-crunching. And I like to show my work, and perhaps also teach a little statistics along the way. So in a new partnership with Stata, I’ve put together a worksheet so that you — or if you’re a teacher, your students — can work through this style of analysis for yourself.
Click through here if you want to work through this analysis, pressure test my findings, and keep building your statistical mastery.
Oh, and if you’re an introductory stats / econometrics instructor: Tell your friends.


