



Another week, another avalanche of economic news. Economists are like everyone else—at the end of a long week, we just want to sit down with a mate for a drink and debrief the economy in depth. I’m lucky enough to be joined for this by Stacey Vanek Smith for a series we call Off the Clock. The workweek may be over, but the economy never takes a break.
Here are a few issues we thought were worth a deeper dive:
Nvidia CEO Jensen Huang’s resignation.
This is a spy scandal combined with three alleged affairs (some coming from inside the company). The company was also caught with its pants down on succession planning. Stacey noted that Huang had something like 60 direct reports and no obvious number two. It’s hard to imagine a $4.5 trillion company with no clear vertical structure. And it’s worse once you think about how many people have Nvidia in their retirement accounts.
One man’s affairs combine to be a macroeconomic event.
With each new revelation, Nvidia’s stock fell. That meant it ended this week down about 12 percent—roughly $600 billion. People often say the pyramids of Giza are so big they can be seen from space. Well, Nvidia’s losses are now big enough to be seen in the macroeconomy. Around 80 percent of U.S. stocks are owned by Americans, so let’s call that $500 billion of household wealth gone. It’s an anti-stimulus (Obama’s stimulus was about $800 billion). The difference here is that a stimulus check goes to everyone, while the top 1 percent hold about half of all stocks.
But is this the most expensive shag in history?
That’s what I said when posting about this week’s crazy markets. But Stacey fact-checked me here.
When Henry VIII married Anne Boleyn, he split England from Rome. At the time, the Church owned about a quarter of England’s land and employed about one percent of the population. The equivalent would be 3 million Americans losing their jobs.
Then there’s Cleopatra! Her tryst with Mark Antony ended in defeat, which meant that Egypt’s treasure was hauled to Rome—and Roman interest rates fell from about 12 percent to 4 percent. That’s an 800-basis-point rate cut!
If you’ve got a candidate for a more expensive shag, drop it in the comments.
Should we be worried about the AI economy’s plumbing?
Stacey is. Nvidia is about 6 percent of the S&P 500, and because of what’s called “circular financing,” it acts as the bank for a lot of AI development. That means linvesting in firm like CoreWeave, which uses that to buy Nvidia’s chips. Nvidia has committed $30 billion to OpenAI and promised another $10 billion to Anthropic. Stacey’s line was that the debt is coming from inside the house.
My case is a bit different. If this is a gold rush, Nvidia sells picks and shovels to customers who are currently unprofitable. Their revenue, if it materializes, will all arrive in the future. That means nobody has a bigger stake than Nvidia in those companies’ ability to keep buying chips! Unlike 2008, this isn’t an opaque web of debt and lending that nobody can map. It’s three or four companies whose books we can (mostly) see.
What I lose sleep over is a slightly different risk. AI could be like wheat: extremely important to the economy, but if the market remains competitive, it won’t deliver much by way of profits. That’s good for consumers! But it would make those loans look shaky.
Chart Versus Chart
My favorite part of the week is always Chart Versus Chart, when Stacey and I try to beat each other in describing the economy (visually). It’s the comp lit major vs. the econ PhD.
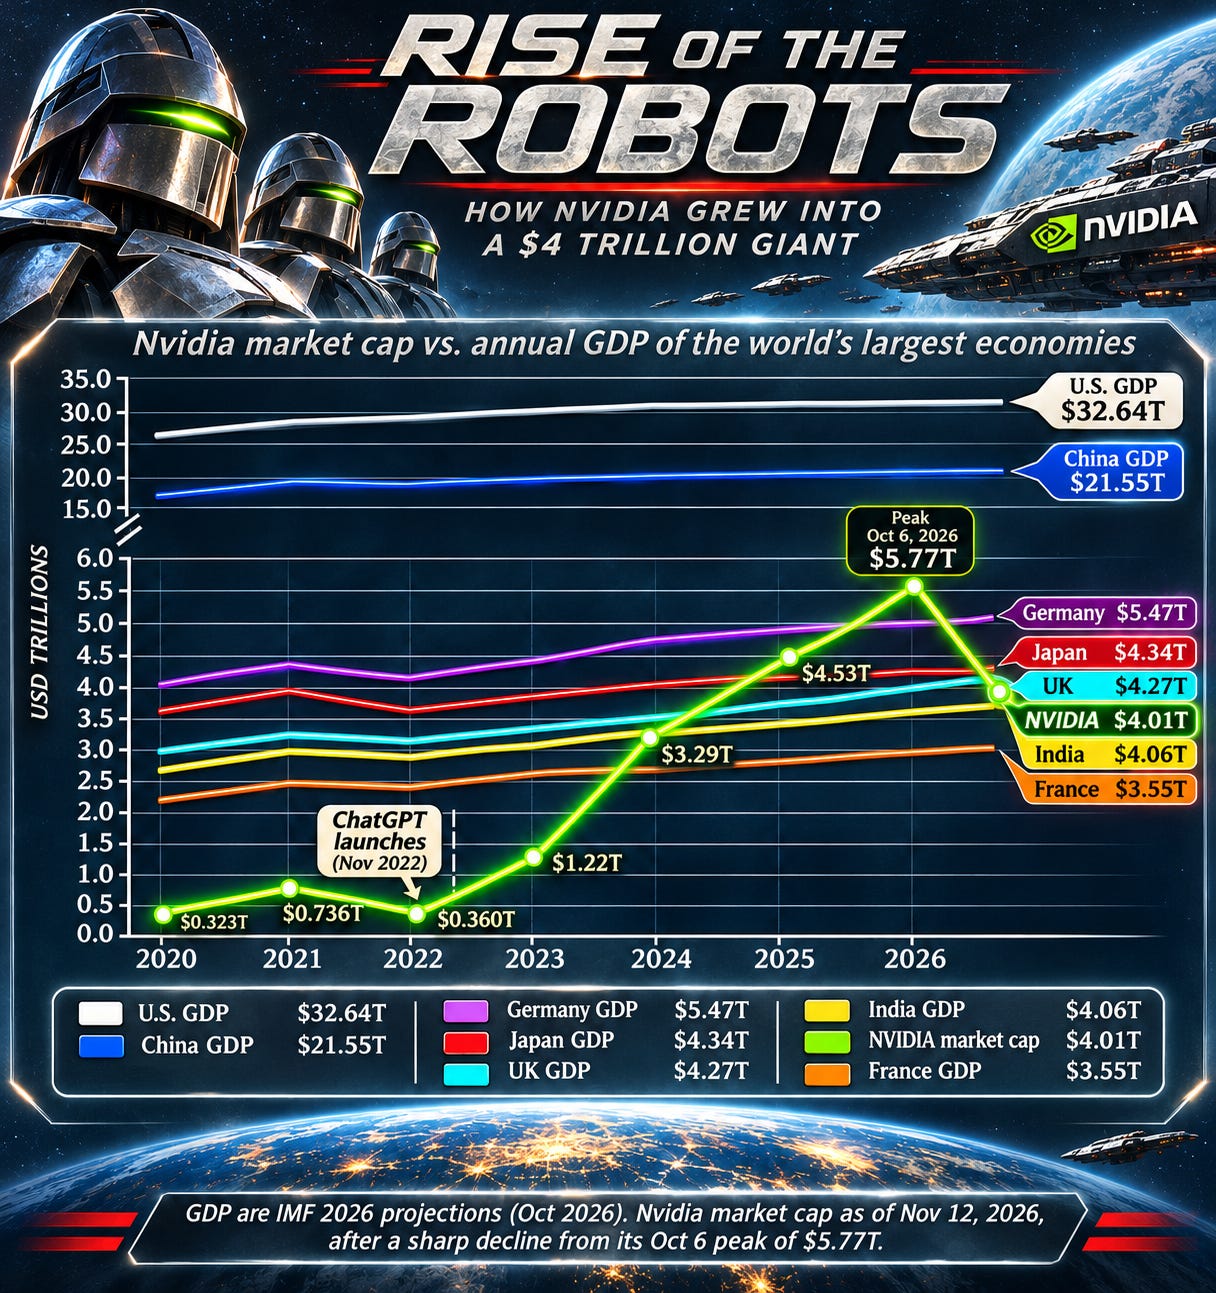
Is Nvidia the size of a country? Stacey ranked the world’s economies by GDP. When you slot Nvidia in, they’re the sixth in the world—ahead of India, France, and Italy (and behind the U.S., China, Germany, Japan, and the U.K., in that order). In 2022 Nvidia was worth about $0.3 trillion, and at its peak, it was $5.7 trillion, which would have made it the third-largest “country” on Earth.
I threw a flag on the play. We’re comparing a stock to a flow, since GDP is what a country makes in a year and market value is what investors will pay for all of a company’s future profits. But the growth really is staggering. It also explains the governance mess: this is a giant company that was a much smaller one very recently.
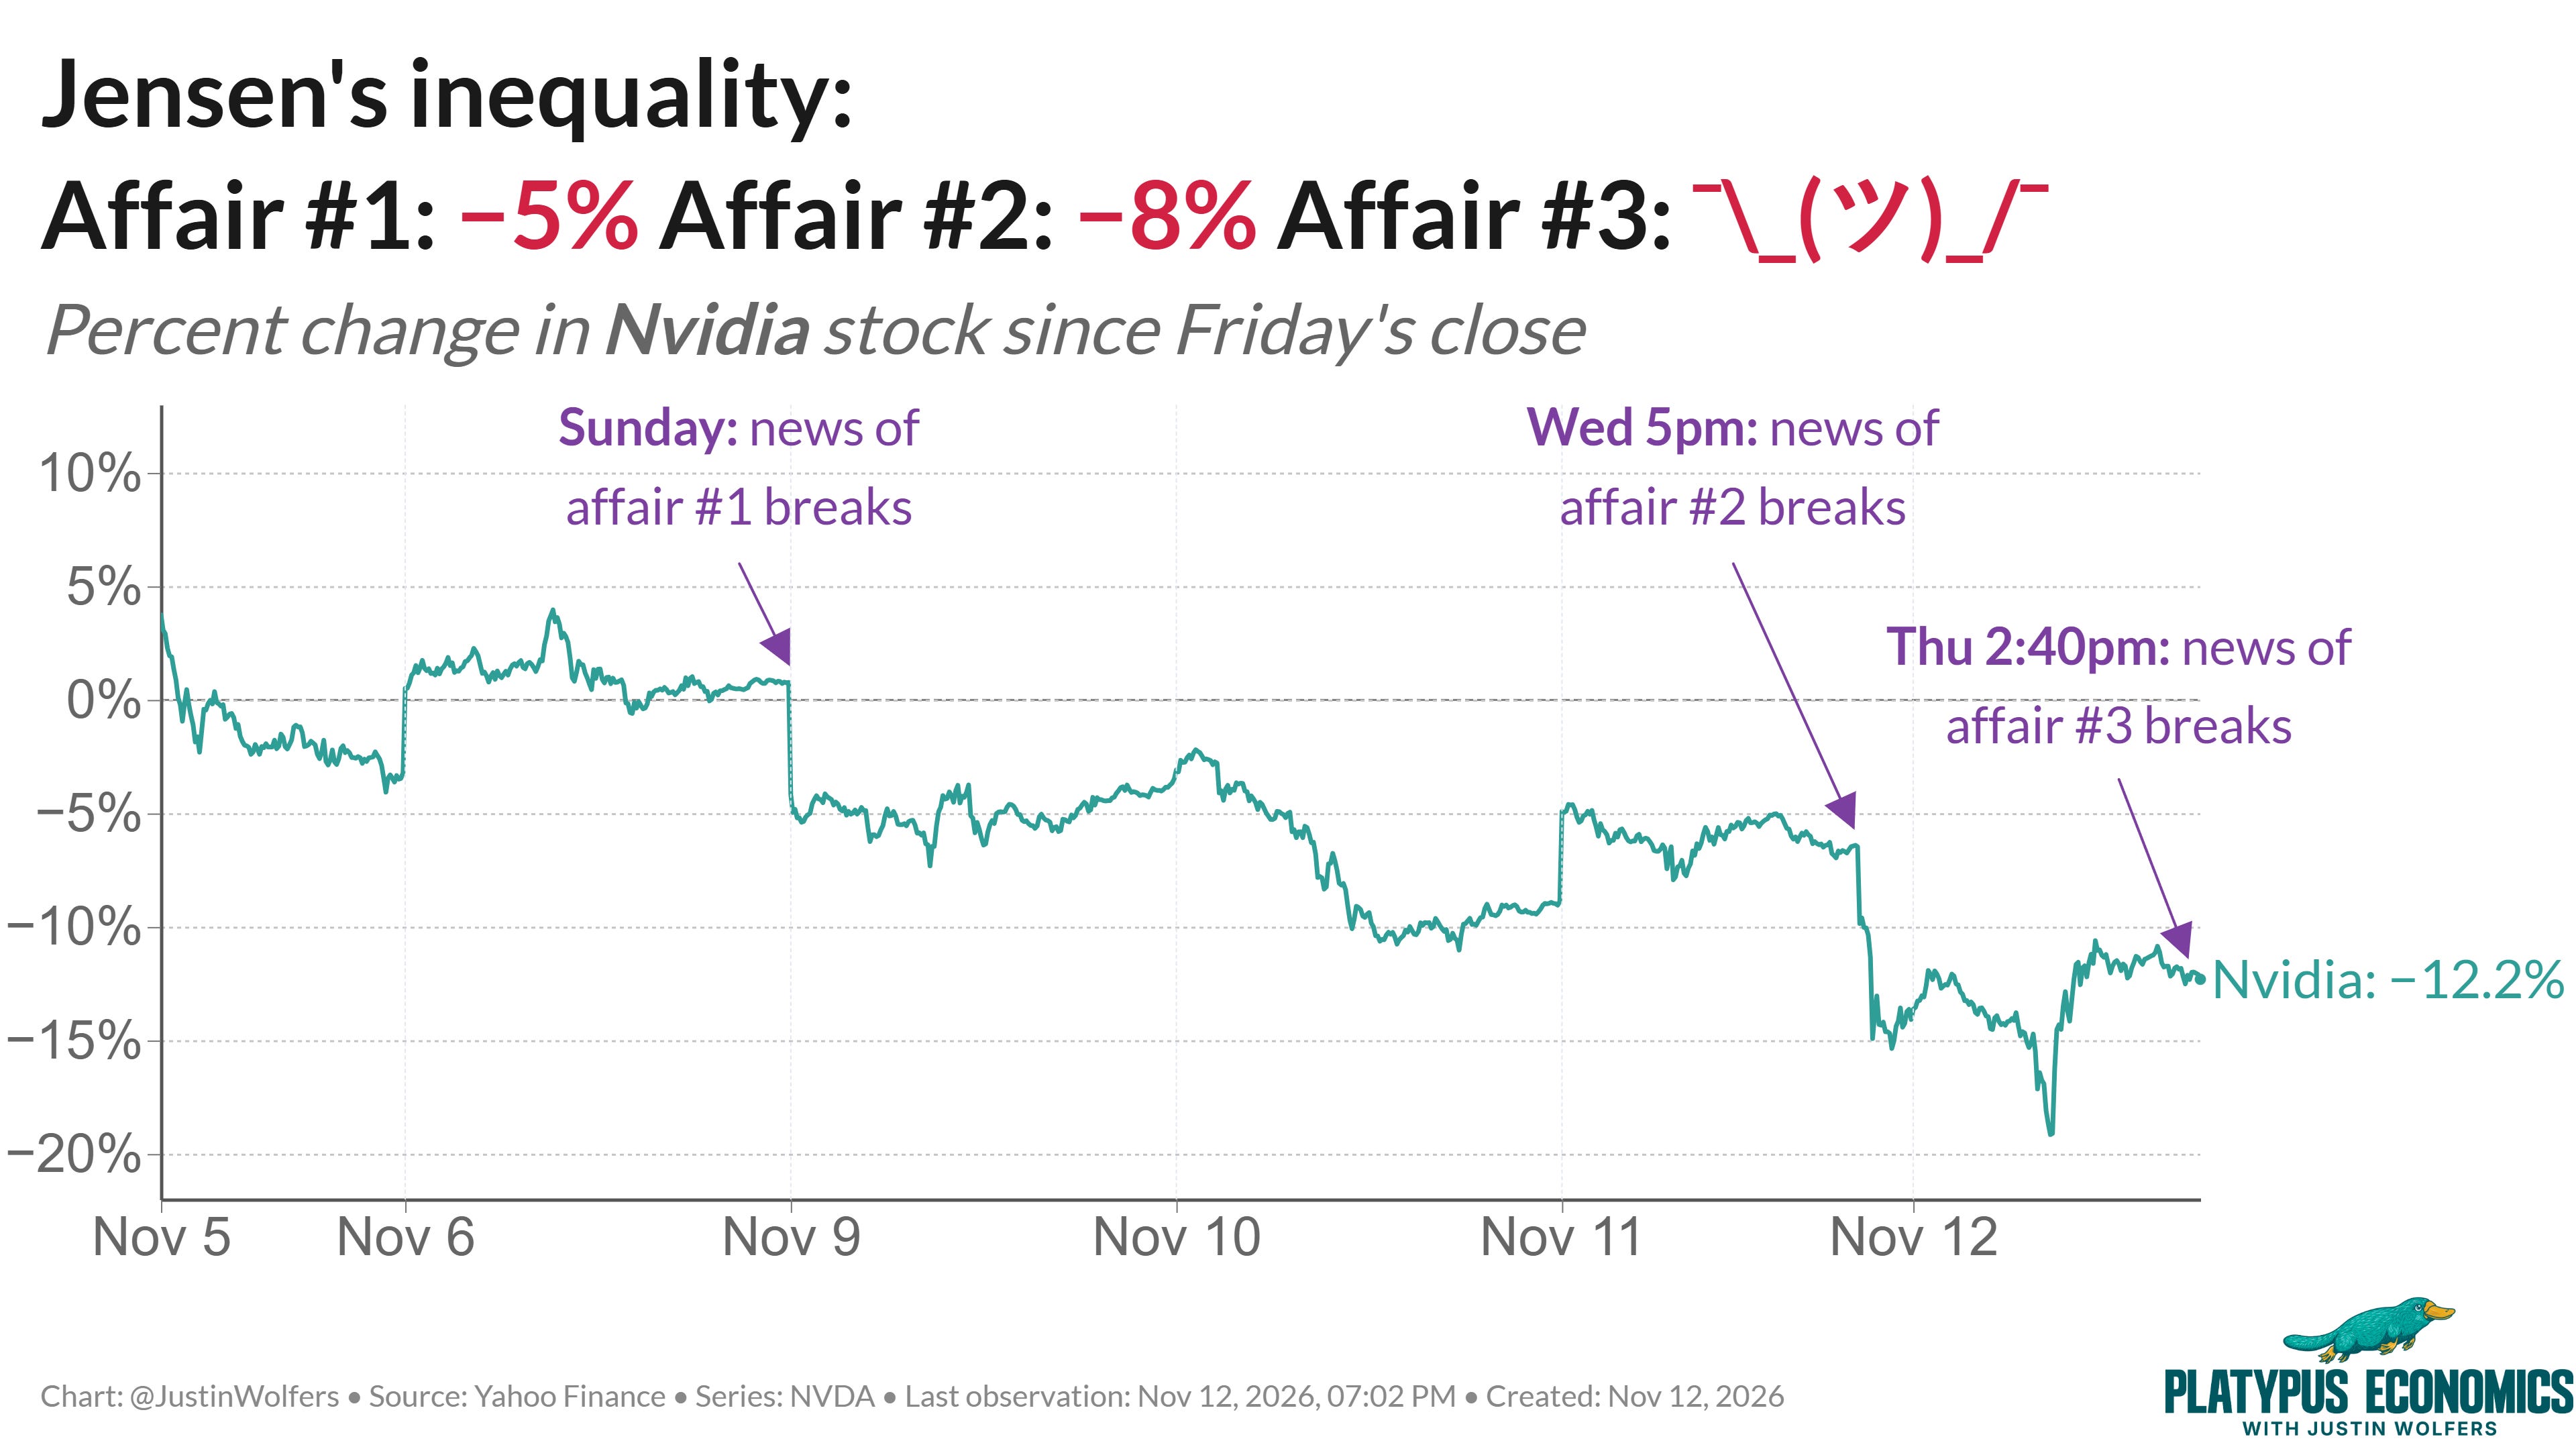
An event study looks at a stock in a narrow window around a piece of news, so you know the news caused the move. News of the first affair knocked Nvidia down 5 percent. The second affair (which, Stacey rightly pointed out, broke alongside the resignation) took it down 8 percent. The third affair? The market shrugged. That’s diminishing marginal returns. And the dad joke is that it’s a textbook case of Jensen’s inequality.
And finally, it’s time to announce the winner of our Halloween costume contest! That honor, and a special, coveted Gus the Platypus Pillow, goes to Doug Stan. He teaches economics at Boise High… which is Stacey’s alma mater. Doug went as Mr. Monopoly. To every high school econ teacher out there showing your students how fun this can be: you’re the reason I became an economist. Thank you.

I threw the same flag on Stacy's chart that you did. GDP is basically "gross revenue" so comparing stock price to GDP is comparing apples and oranges. GDP compares with annual sales for a company. "NVIDIA's annual revenue was $215.94 billion for fiscal year 2026 (ended January 25, 2026)." That amount is barely a blip on Stacy's chart. Looking the other way, the Fed estimates that "The total value of public and private assets in the United States exceeds $380 trillion to nearly $400 trillion combined." A $5 trillion value for NVIDIA is again a small fraction (1.25%) of the total value of the US (as it must be since it is mostly owned by US people and is thus mostly included in the total value of the USA). On that basis I voted for your chart, Justin.
Clearly there are some NVIDIA chips being used to create Stacy's chart. 😉 Props to Justin for the shrugging text emoji. Old school has its charm. 😊