


The American economy added 29,000 jobs in September.
That’s the headline from the jobs report, which came out early this morning. It’s the last jobs report before the midterms, and it’s an important one. But that 29,000 number doesn’t mean much without context, so today, let’s look at three different ways you can make sense of this headline number.
First: ask what the number means on its own terms. The economy is creating jobs, but barely. There are 340 million Americans, so this is a very small fraction.
Second: compare this with what we expected. As of last night, forecasters thought that this jobs report would show 80,000 or 90,000 new jobs added in September. So by any measure that’s a disappointing shortfall.
The third way, and the one that I really care about: ask about the story these numbers tell us. How does this change what we’ve been telling ourselves about the economy?
Should we be worried?
On one front it’s more bad news. In addition to low job growth, this jobs report also revises the prior two months’ reports. That’s just the addition of new data businesses sent in after the Bureau of Labor Statistics deadline. August’s jobs report was revised down by 29,000 jobs. July’s report was down by 31,000. With these revisions, it now appears that the economy actually lost jobs in July.
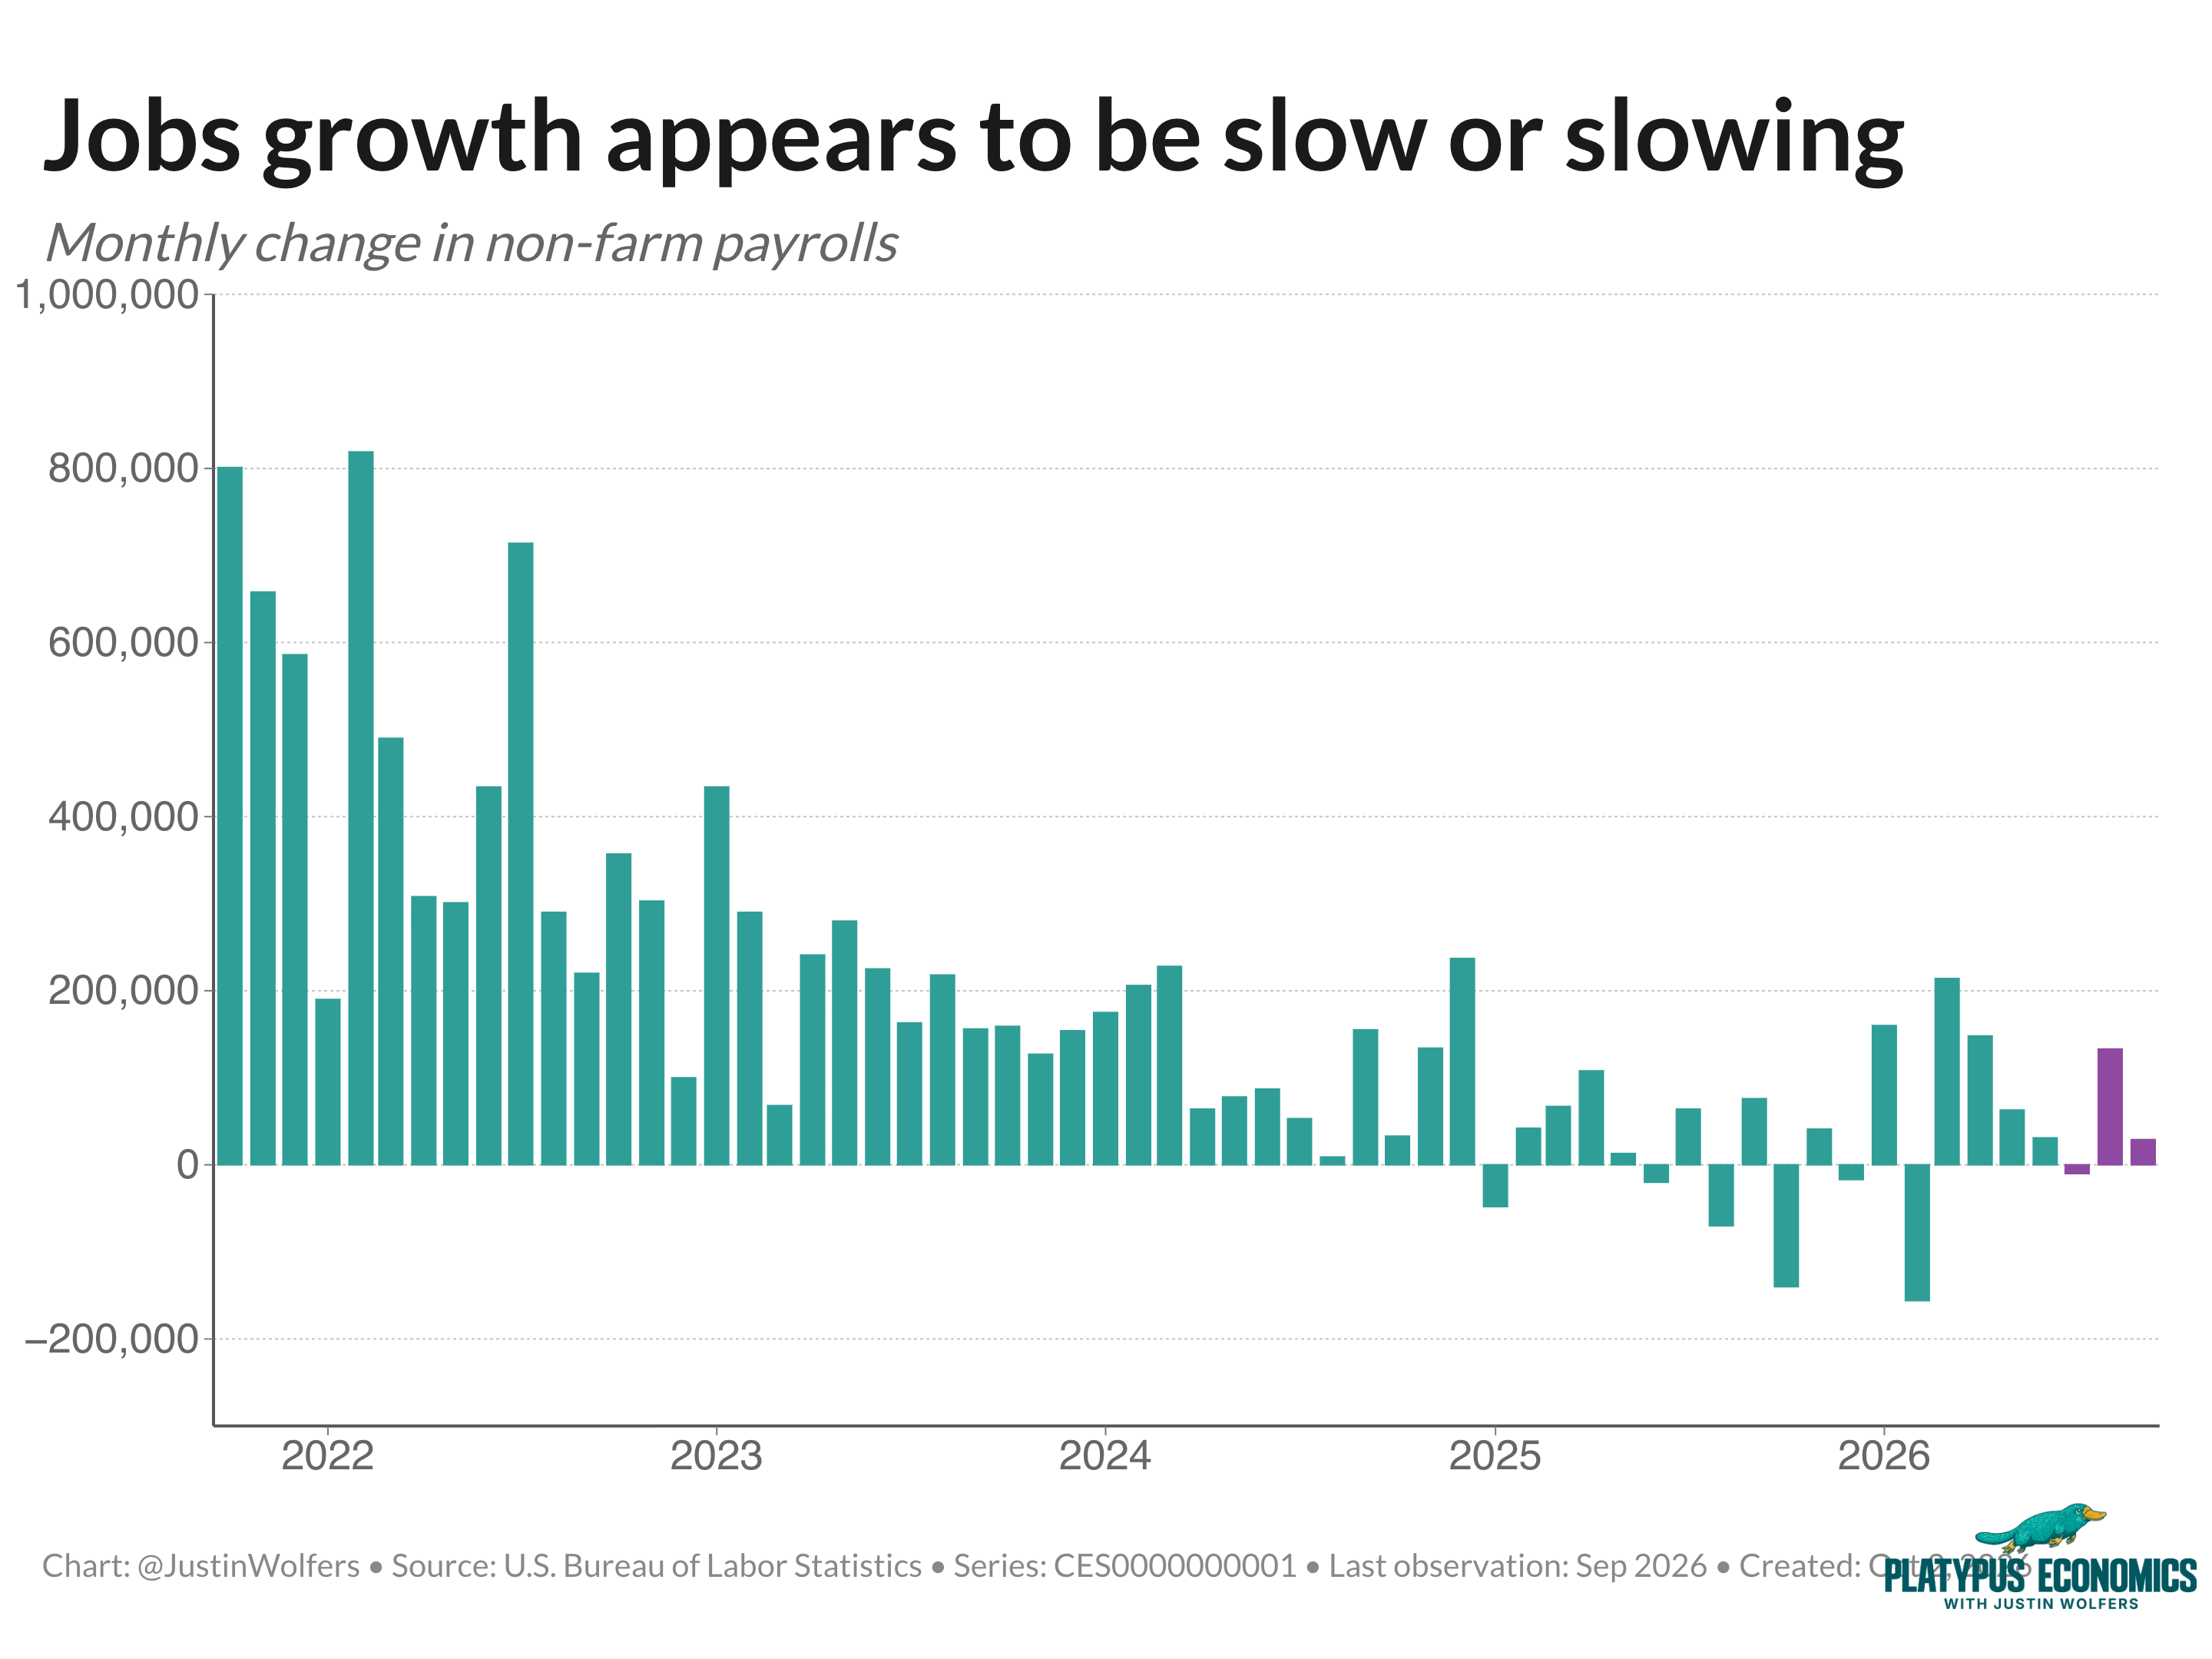
Here’s the thing that’s hard to square. The unemployment rate barely rose, from 4.1% to 4.2%. It’s been stable for a few years now, and 4.2% is low, both by historical standards and compared to other countries. For most of my career we’d have been delighted with an unemployment rate that began with a four.
How is job growth weak while unemployment is low? Think of the economy like a treadmill. With a growing population, we have to create jobs at a certain pace to keep unemployment steady. That rate is what economists call break-even jobs growth. A few years ago, it was around 200,000 jobs per month.
But the president’s crackdown on immigration has changed that. Now there are more deportations, people leaving the country, and far fewer foreign workers and students arriving. The U.S. is now close to having no population growth for the first time in a long time.
That means the treadmill has slowed. Break-even jobs growth has most likely fallen, possibly dramatically. It might even have fallen to where we are now. So, today’s “disappointing” jobs numbers may just be our new normal. At least, they’re a new normal amidst so much anti-immigration action.
Healthcare vs everyone
Another interesting story in this report is where the jobs are coming from.
Effectively all net job creation since January 2025 has been in healthcare and social assistance. More than all of it, actually. That sector has added nearly a million jobs to the economy, while everything else has shed about 220,000 jobs.
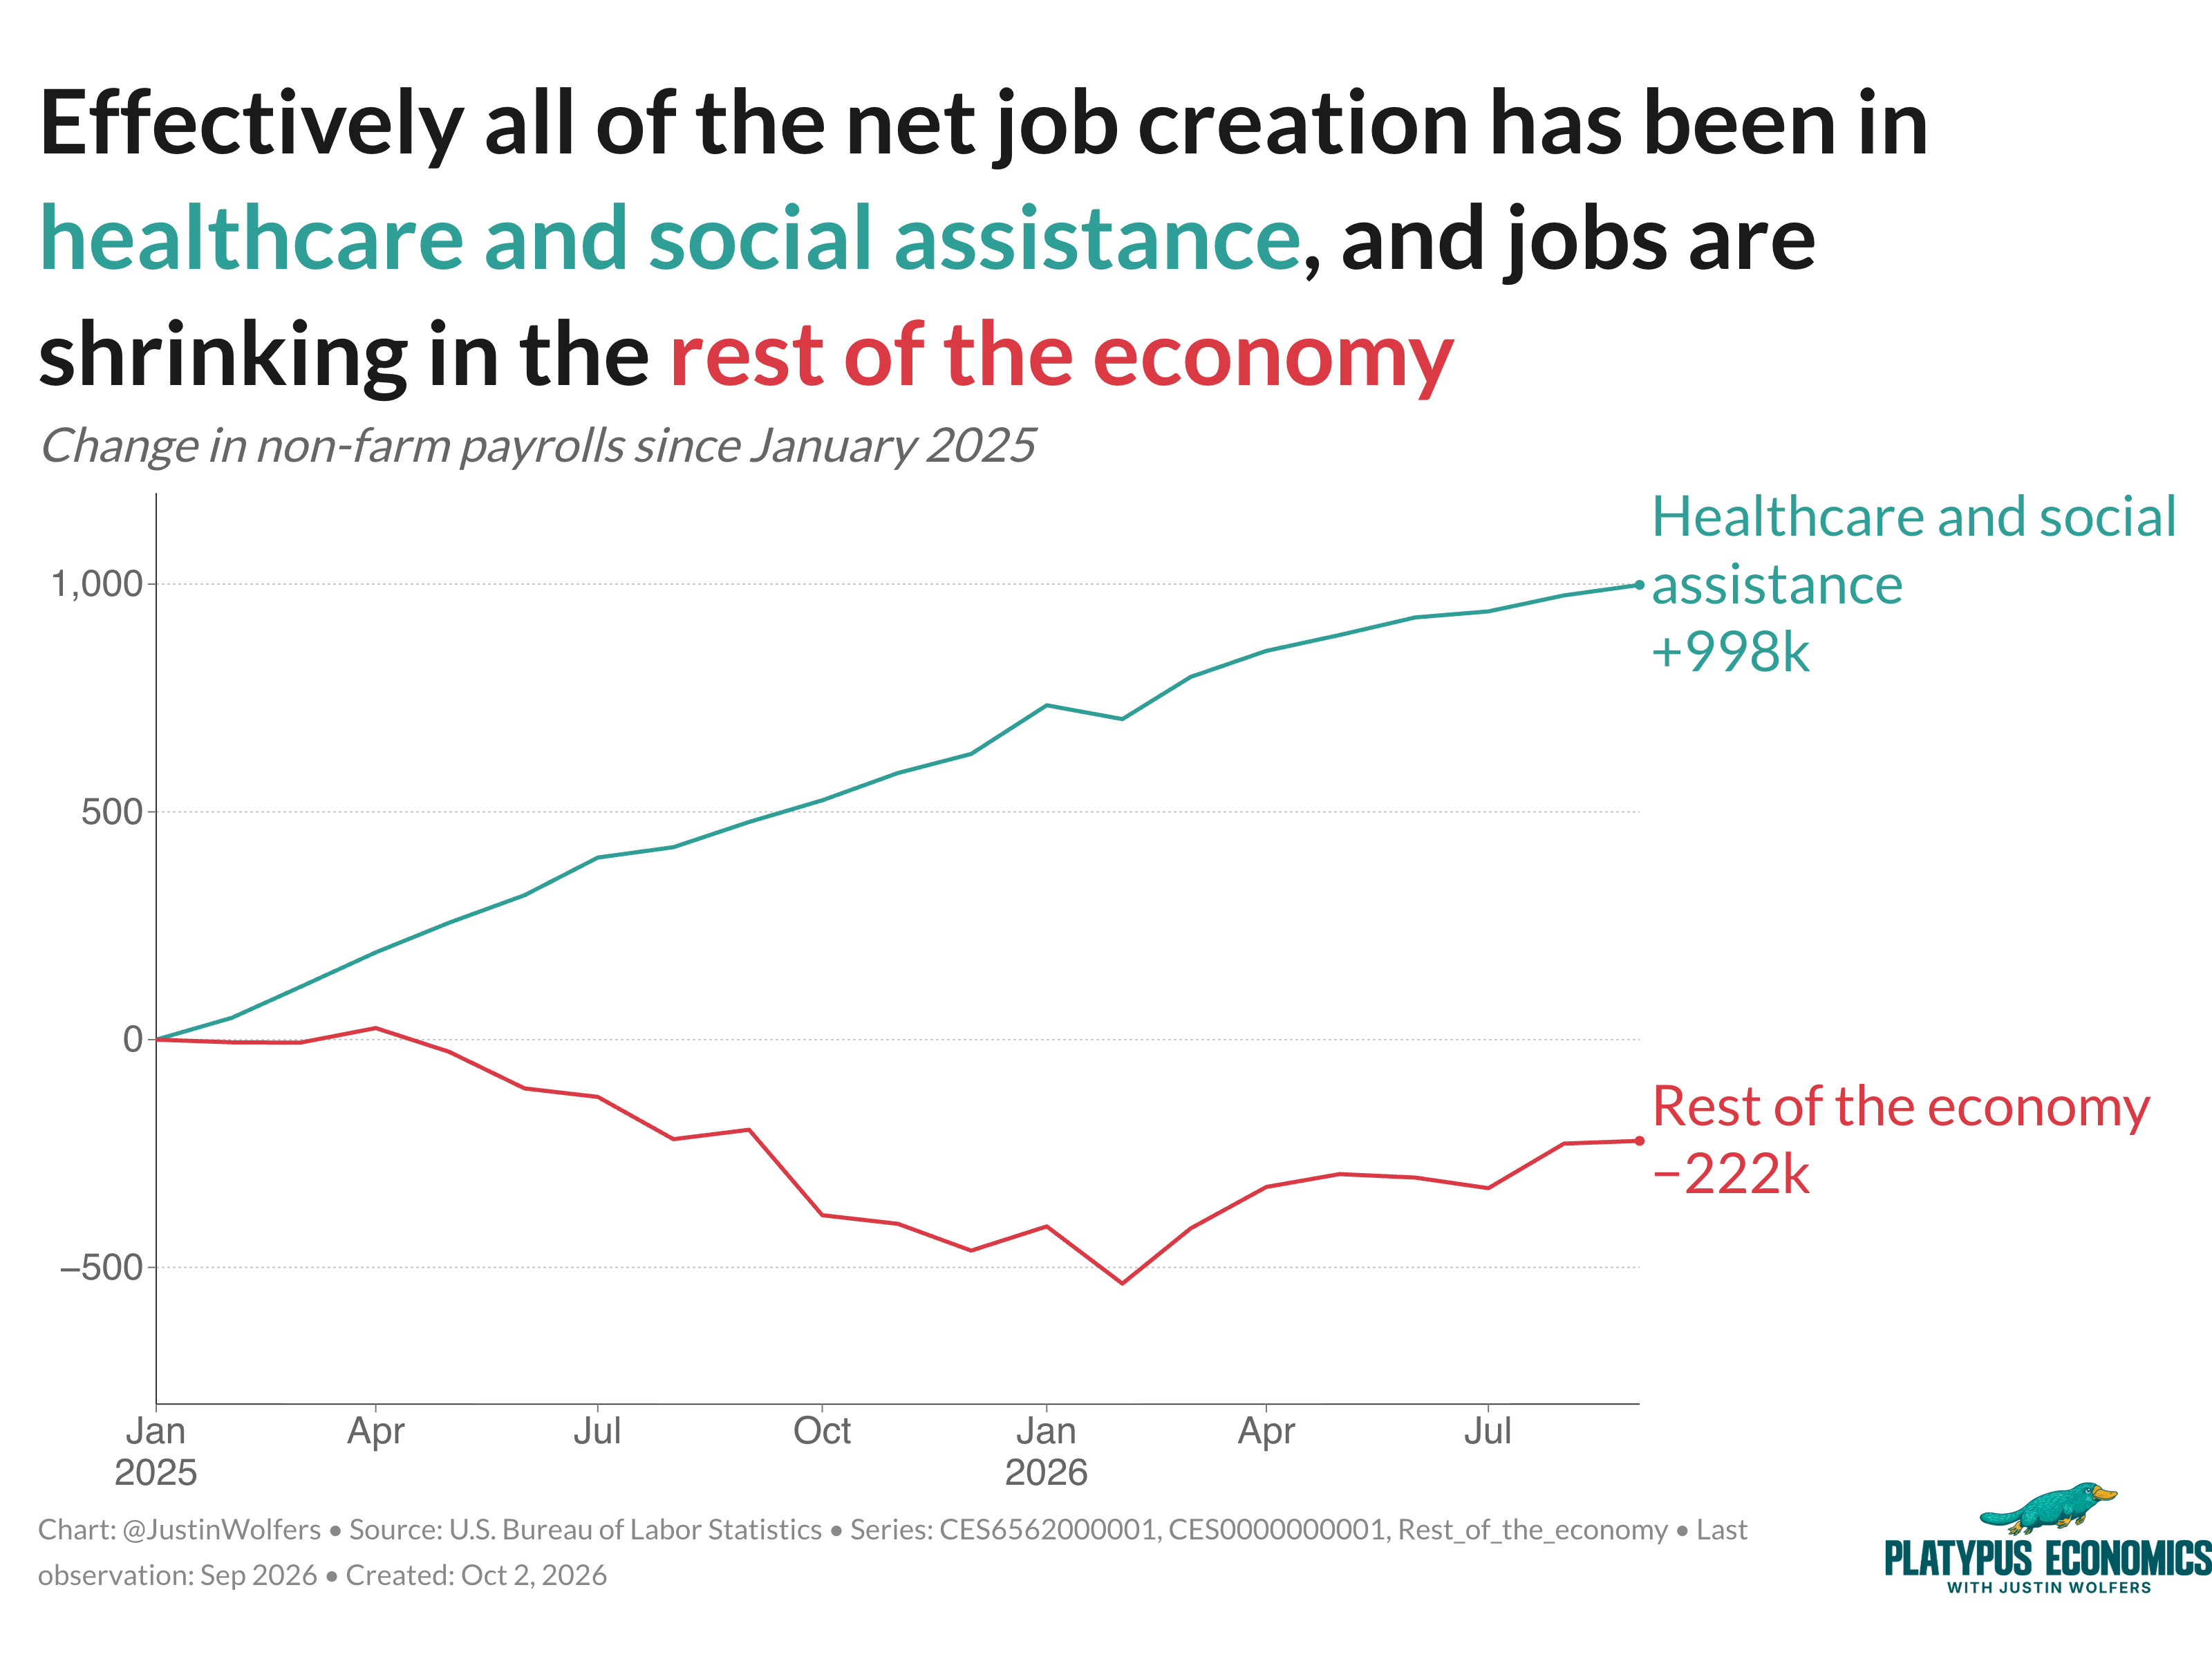
Healthcare is the little engine that could. It’s a relentless source of jobs.
And yet, you’d never know that from our political debates. We hear about tariffs, oil, steel-toed boots and blokes in hard hats. We don’t hear about the healthcare sector, even though it is radically transforming our economy.
It also explains a striking fact. During President Trump’s second term, 8% of job growth has gone to men. They’ve gained about 65,000 jobs. Women have gained about 711,000 jobs.
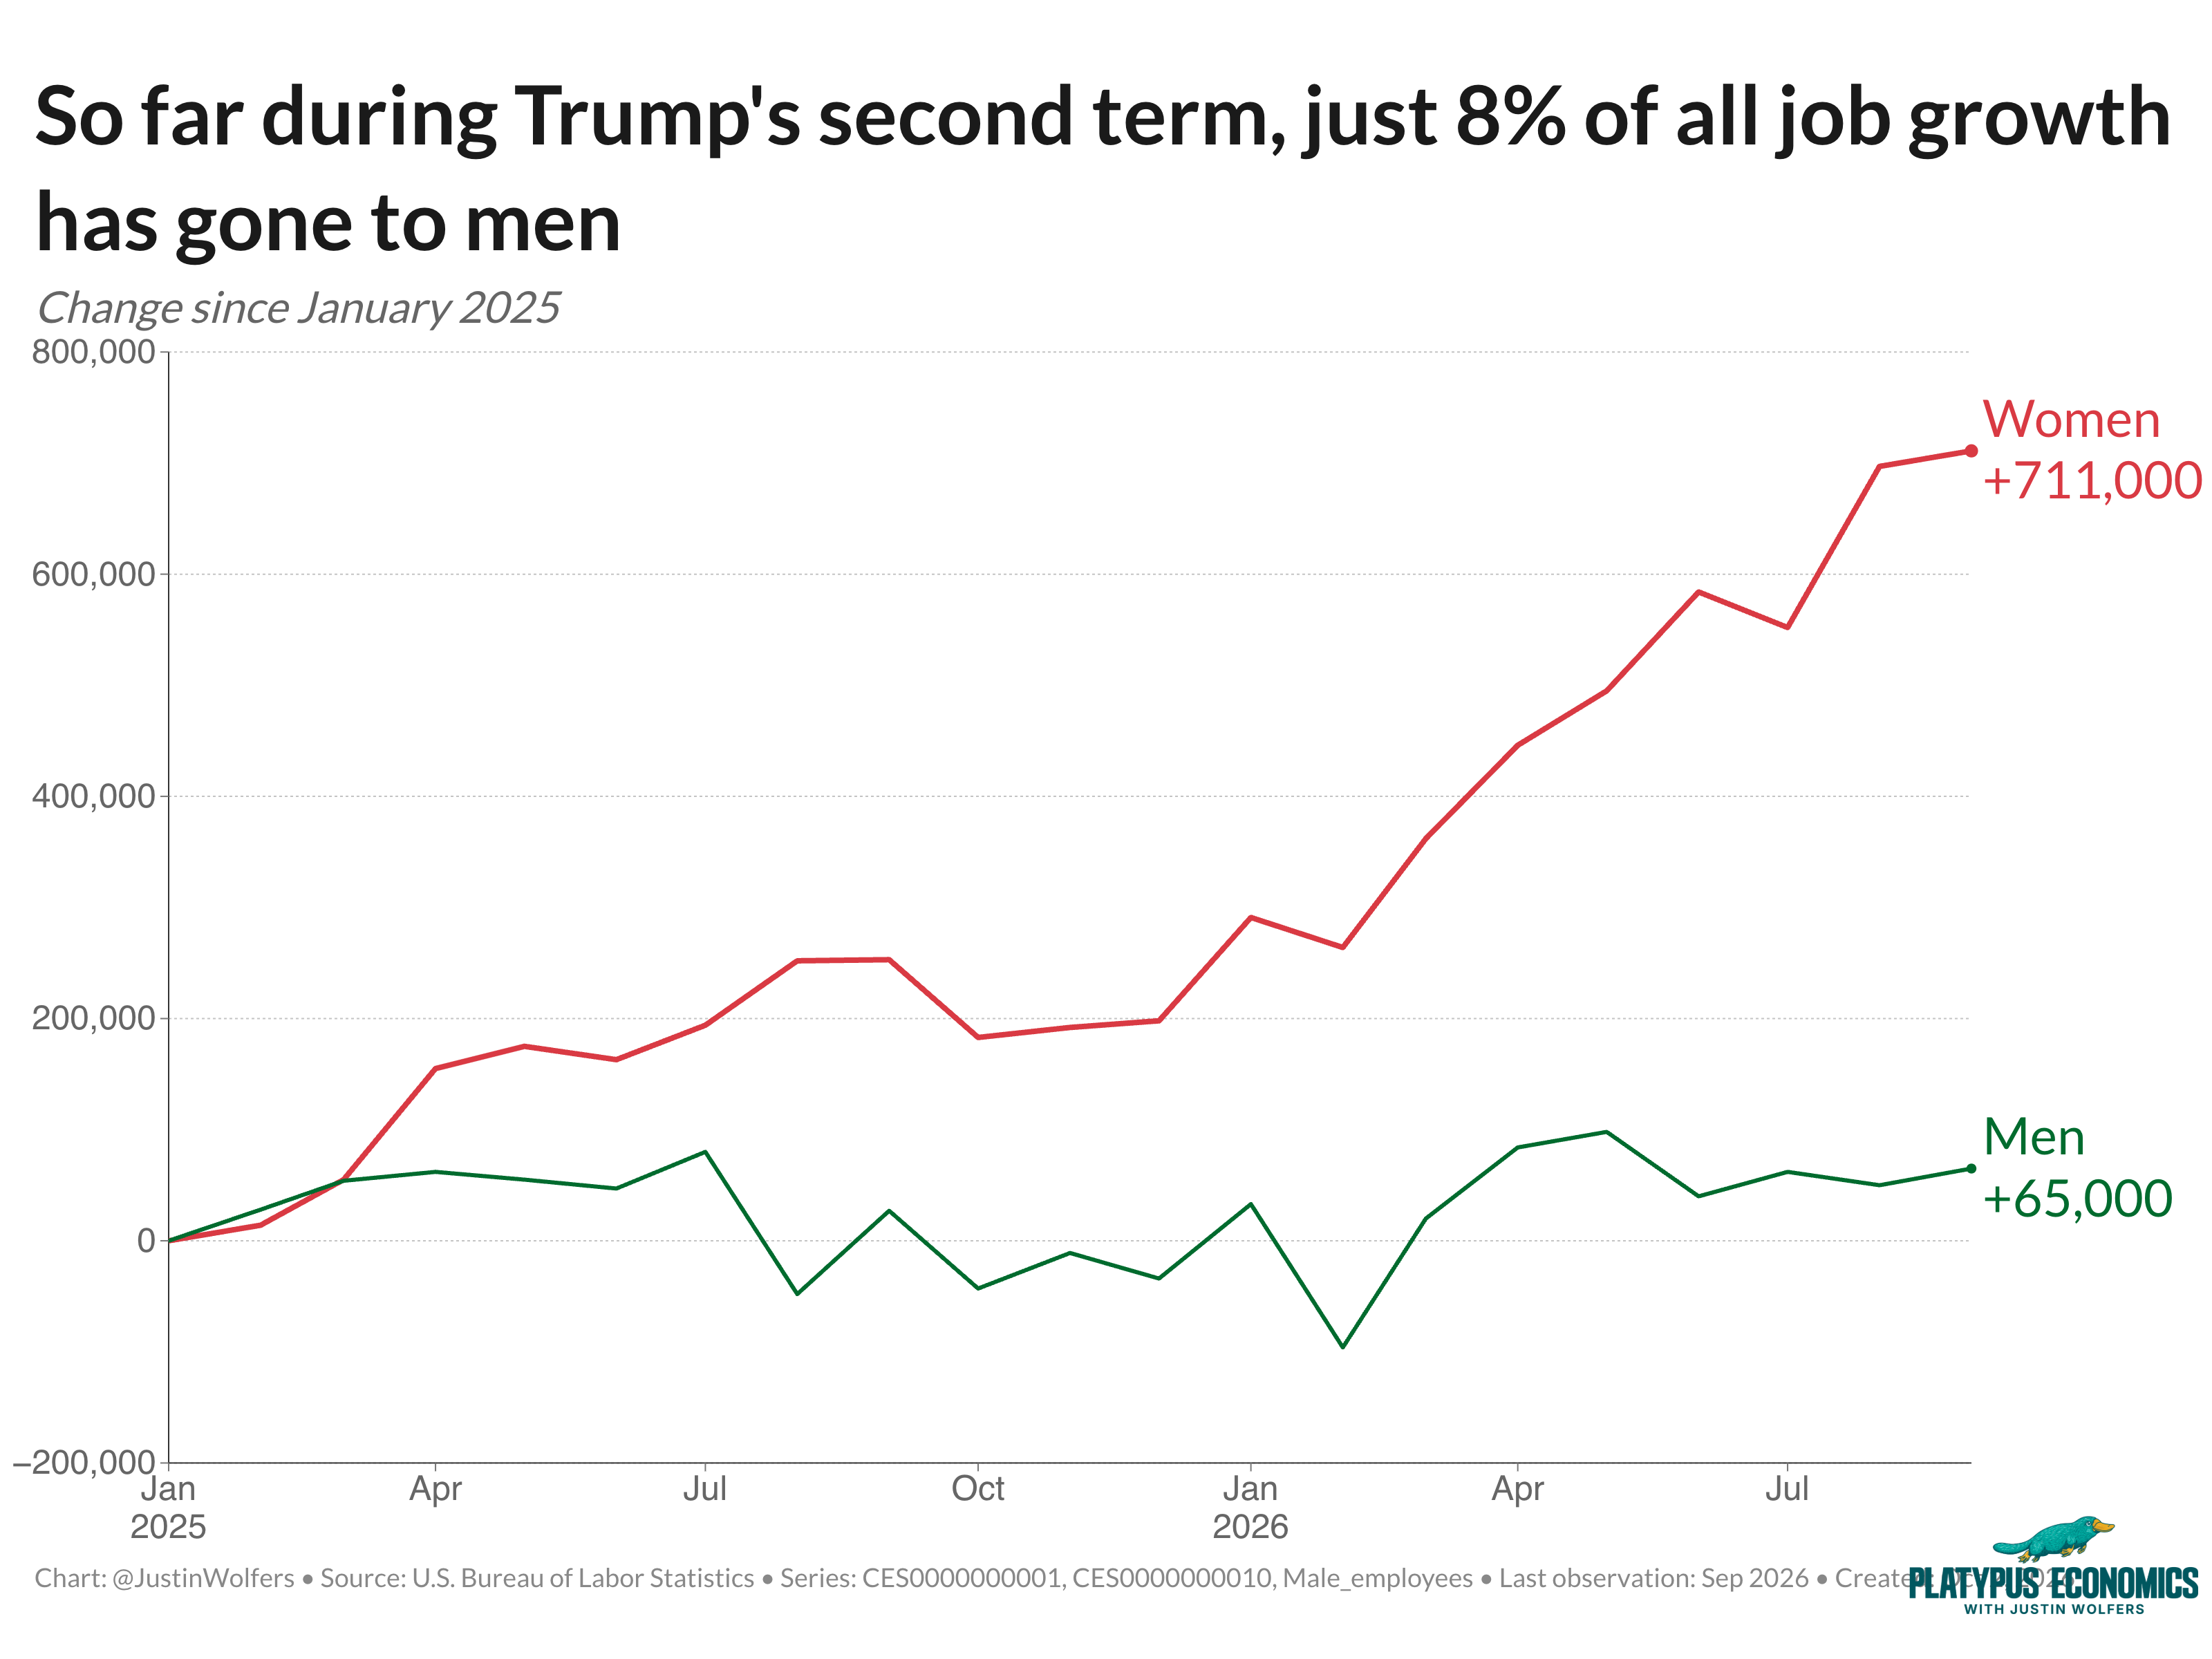
We dug into the why of all of this a few months ago, and it mostly comes down to the fact that jobs are being created in sectors where women already work. Healthcare is an obvious example.

Meanwhile, other sectors are losing jobs — information (10,000), finance (7,000), professional and business services (9,000). It’s not hard to notice that all those sectors are highly exposed to AI. So does that mean AI is quietly showing up in the jobs data? Maybe. I honestly don’t know if firms are replacing workers, holding out on new hires, or if something else is happening — and the data just isn’t good enough to tell us yet.
And then there’s your paycheck. If you feel like you can’t keep up, you’re not imagining that. Average hourly earnings are up just 3% over the past year. That’s the slowest wage growth we’ve seen in years. Prices are rising faster and wages aren’t keeping up.
What does this mean for the Fed?
Finally: the Fed. All of this matters when it comes to rate hikes. A week ago, inflation looked hot and the job market looked healthy. Markets put a 64% chance of a rate hike at the Fed’s October meeting (the last before the midterms).
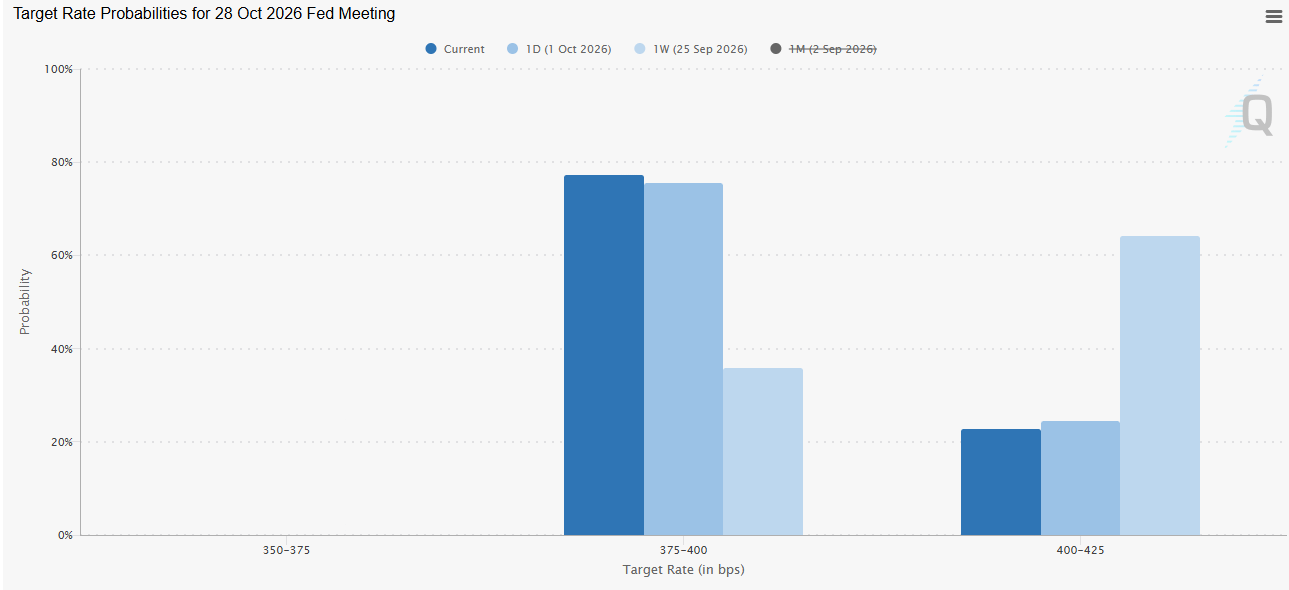
Then Wednesday’s Personal Consumption Expenditures inflation numbers came in — that’s the Fed’s favorite flavor of inflation — and they were softer. The odds of a rate hike fell to 24%. Now, with job report in, they’re down to 20%.
Hikes are still coming — later. Markets are now predicting October’s hike has been pushed back to December. But a hike before the election looks less likely.
Weak wages are, oddly enough, a help here. Labor is the biggest cost most businesses face. Slow wage growth gives the Fed a little more confidence that inflation will keep easing.
Wall Street actually seems pleased, which might seem odd, given that we learned that the economy is a bit weaker than we thought. Investors are fixated on the Fed. A delayed hike looks good for profits. I am a bit more focused on Main Street.
Technically, we’re fine
So what does this report tell us about November? Well, it says that the economy is kind of, sort of, somewhat okay.
That qualification should tell you a lot. Jobs growth has slowed sharply and wages are falling behind prices. But this isn’t a reason to panic. We’re adding jobs, and unemployment is low and stable. Still, if people say they’re worried, I won’t argue with them.
This also tells us something politicians rarely mention. Our economy is hitched to one little engine that could: healthcare. Well, it’s not such a little engine anymore. That’s worth keeping in the back of your mind when anyone tells you what this economy is “really about.”
One last thing for the nerdiest of my Platypals!
Today’s post includes a paid partnership with Stata, the software I use to crunch the numbers in my posts (and my research).
I used it here to do my own calculations on the jobs report. And if you’re really nerdy, you can use this worksheet to follow along! Or if you’re an economics or econometrics instructor, you might find this useful for class.