


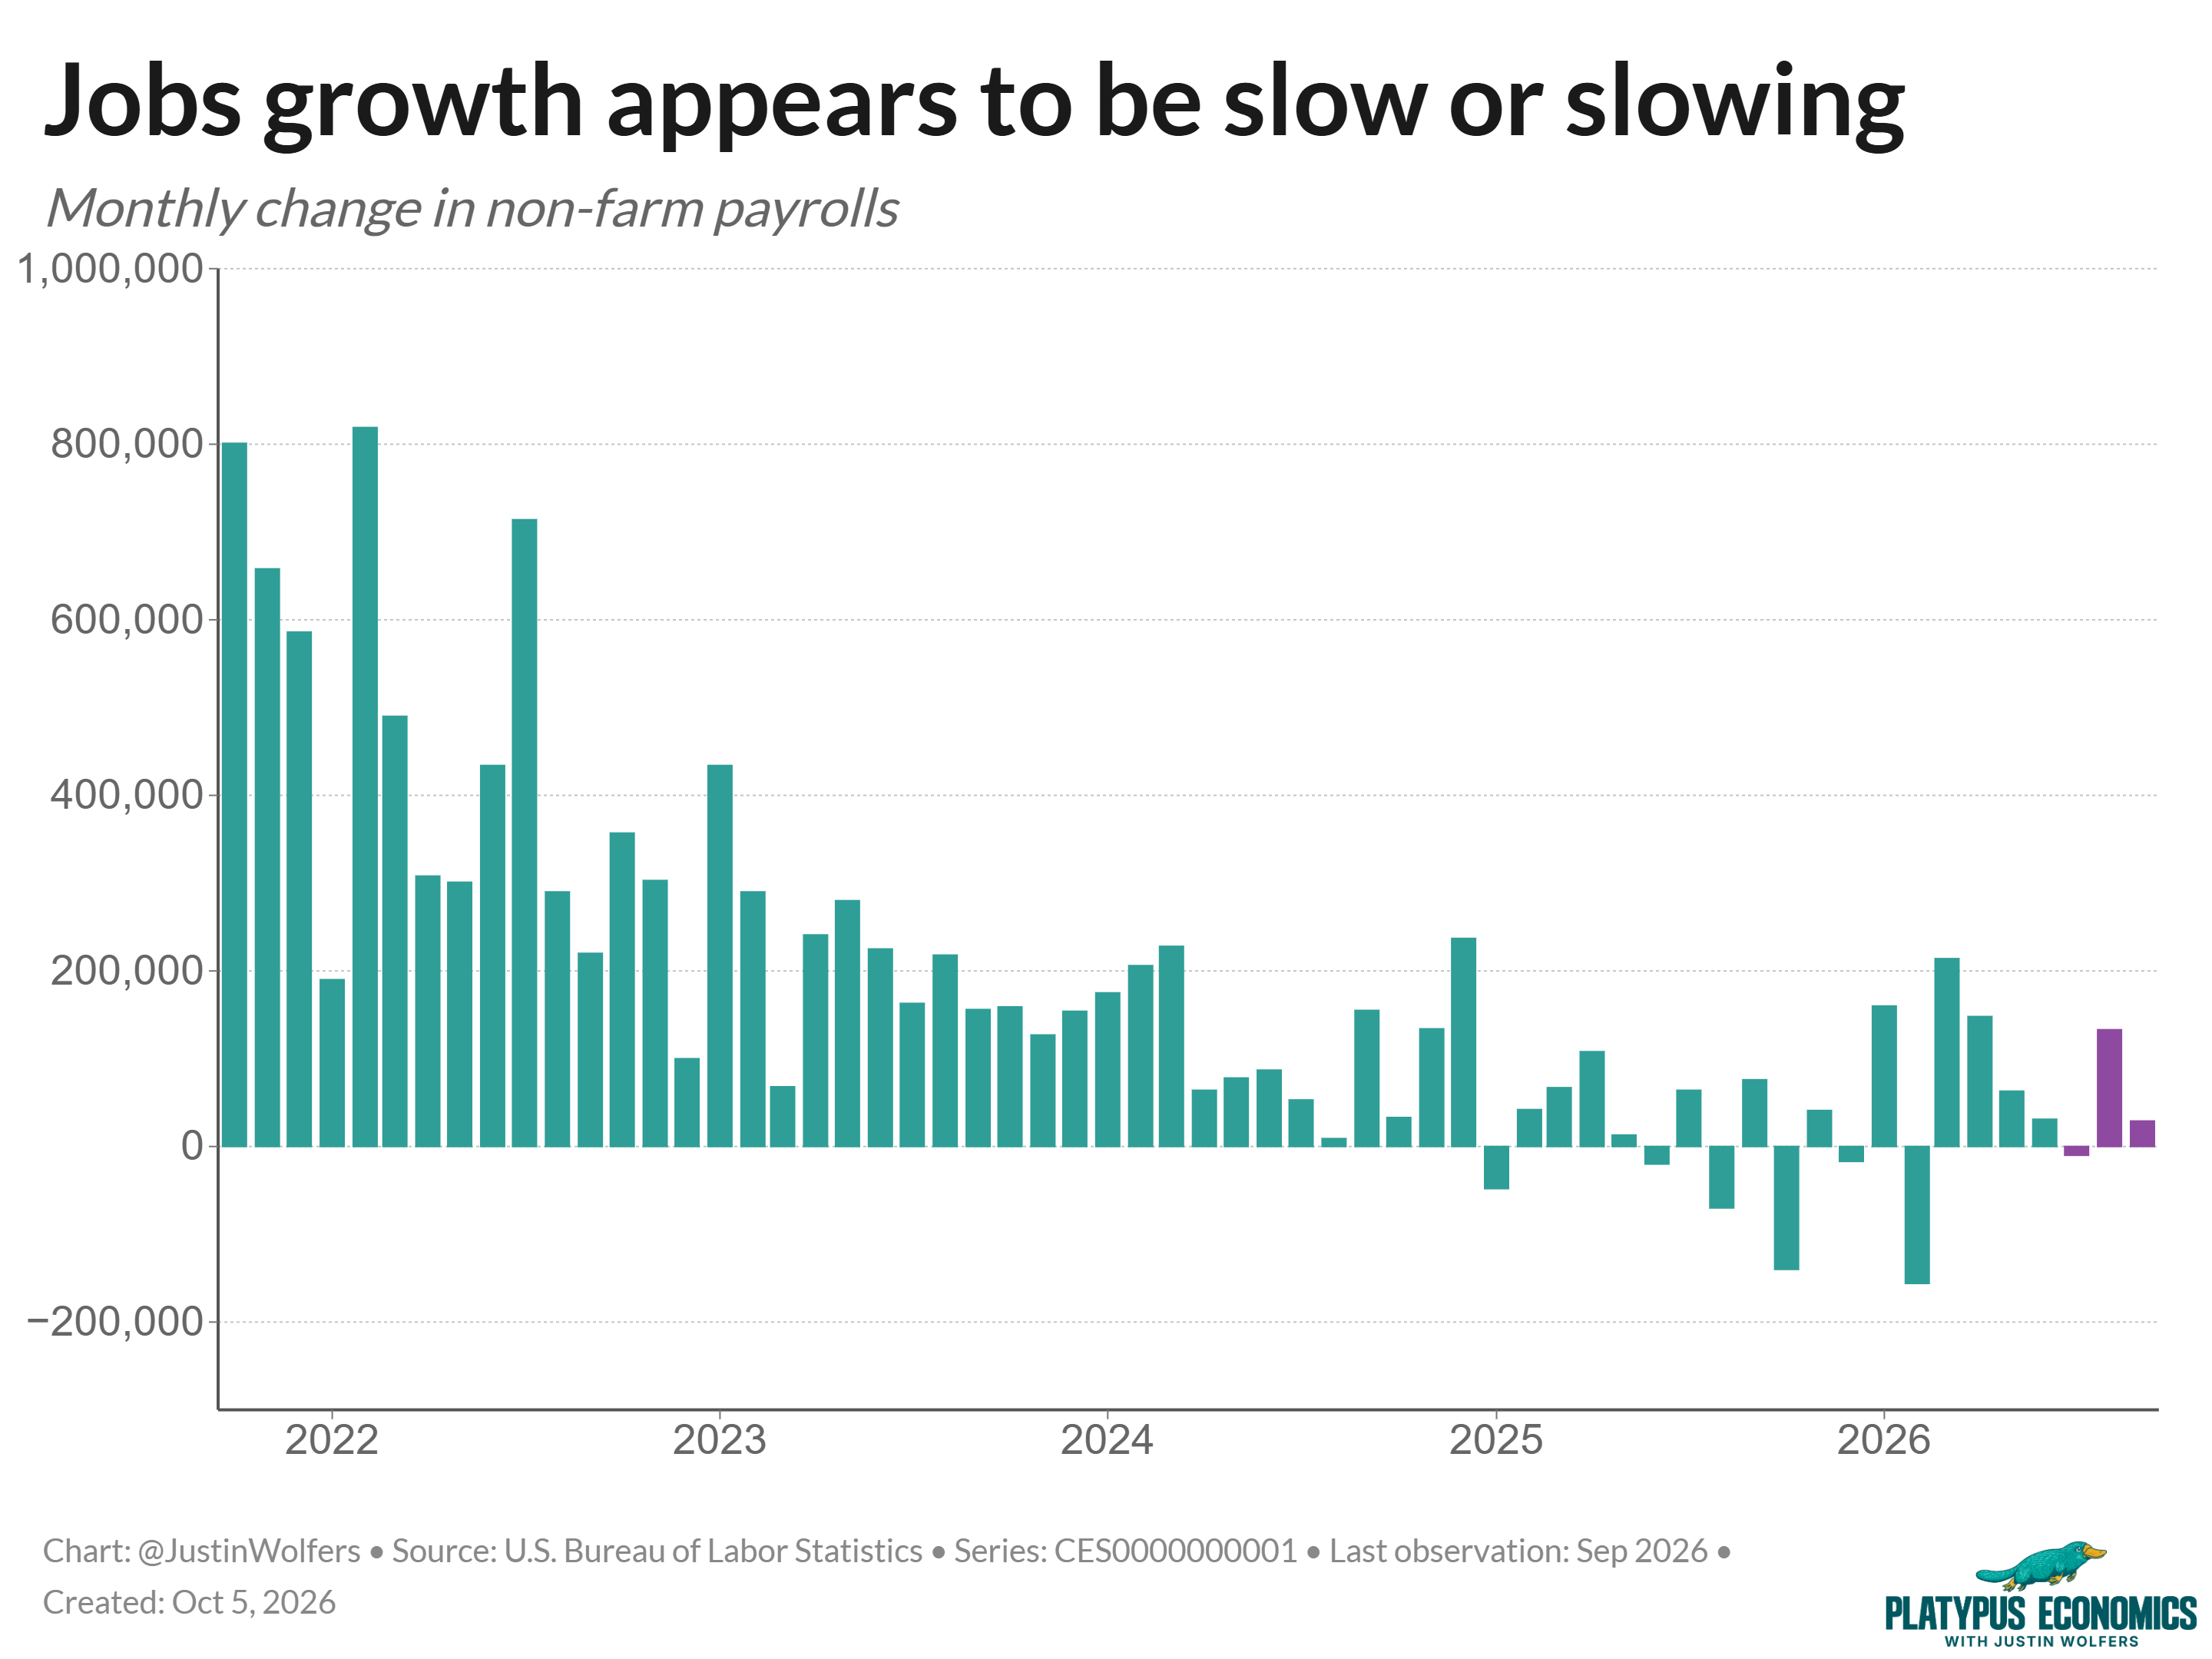
Last week, I walked through the jobs report for September. The headline was that the economy added 29,000 jobs, far fewer than forecasters thought. Job growth is slow and mostly happening in healthcare. Everyone else is either shedding jobs or in wait-and-see mode.
Now it’s time for The Professor Is In, where I sit down with my producer Augusta to take your questions. Think of it like office hours — my door is open, come on in.
And if you missed the post on the jobs report, you can catch up on that here:

Where are these revisions coming from?
One question Augusta brought me was about revisions to the jobs report. When we got the September numbers, we also got revisions to the July and August numbers. Those new numbers show that, contrary to previous reports, very few jobs were created this summer. Actually, the economy probably lost jobs in July, and the August boom was smaller than first reported.
Augusta wanted to know: why all the revising? And should we put any weight on the earlier, more optimistic, numbers?
Nothing in the world is accurate
Let’s zoom out for a second and think about how we measure things. Height seems like an easy thing to measure: you just get a tape measure and stand up straight. Well, I might do that and find that I’m 5’11 and a half, but actually, that number isn’t quite right. I’m probably closer to 5’11.487. Or maybe it’s 5’11.678. I could even be 5’11.821. Measurement always comes with error.
That’s especially true in the economy. We don’t have a tape measure for employment — we can try to line up 340 million Americans and ask about their work, but by the time we finish, many folks will have changed positions or retired.
So instead, we talk to — that is, survey — a subsample. Then we ask: is this sample truly representative? Did we cover enough people, enough of the time? Did we count the people who were hiding from taxes or immigration authorities? Do we have the information we need?
More data means more precision
The jobs numbers come from something called the establishment survey. The government reaches out to a fairly large sample of businesses and asks how many people were on their payroll in a specific week. They make sure they’re talking to a big chunk of the really big businesses, so that the survey is representative of the U.S. workforce.
But sometimes, the government calls and asks for that number while the owners are out at lunch. We all miss an email sometimes. We also might put things off past their deadlines. That includes responding to the establishment survey.
And so the first round of jobs numbers we see is based on the businesses that respond on time. The Bureau of Labor Statistics (which publishes this survey) adjusts for the fact that some businesses have yet to respond, but effectively they’re forced to extrapolate what non-responders would have said.
Eventually those businesses get around to sending in their report of how many folks are on their payrolls. And that’s what a revision is: moving from an incomplete sample to a more complete one.
Don’t split the difference
You might be tempted to think that, because the first jobs number was high and the second number was low, the truth is somewhere in between. That’s not right. The revised number includes everyone in the first round plus the late responders. It’s a bigger sample and a more representative sample. That’s why the revised number is always and everywhere the better guide.
Some people are trying to undermine faith in government statistics. They point to the revisions as “evidence” that something is wrong with the data. On the one hand, yes, something is wrong with all data. On the other hand, no, no and no. Revising your estimates when you get new information is always the right thing to do.
I don’t think of this battle over revisions as being in good faith. It’s a political claim that tries to exploit people’s naïveté about statistics to paint revisions as problematic. Think of it as part of a broader effort to undermine faith that there is a truth at all. This dismays me deeply.
A statistical agency that revises its data is much better than one that doesn’t. It’s like a person who admits their mistakes: they’re more honest than someone who denies ever messing up.
Parsing the jobs report
With that in mind, a monthly jobs report contains three independent sources of information:
The household survey
This month’s payroll survey
New responses to the previous months’ surveys
This month, the household survey was okay. The payroll survey was weak — and so were the revisions. Hence my mood. Not ecstatic, not miserable.
More detail about what’s happening in our economy
Other questions Augusta brought me:
What’s the big picture on all the hiring happening in healthcare? When did it start, and what does it mean?
The world has gotten so much better at making stuff cheaply. So why hasn’t healthcare gotten less expensive?
How did I break my rib in Australia? (The answer is a little embarrassing.)
Finally: is AI taking our jobs?
Augusta also asked about some specific job losses in this report. These are the ones in sectors we might call “AI exposed.” Those are industries like financial services, information, and professional and business services, all of which have been shrinking.
Is that AI at work? If it is, would we even know?
My friend Erik Brynjolfsson at Stanford is one of the leaders in the economics of AI. He’s convinced me that, right now, we don’t have the statistical infrastructure to know the answer here. What does “AI exposed” even mean? We know which firms say they’re adopting AI, but adopting has many definitions. It doesn’t necessarily mean replacing.
A surprising amount of our tracking of AI relies on intuition. For instance, our intuitions say that white-collar desk jobs will get hit first. But our intuitions aren’t always right. Early in the AI revolution, computer scientist Geoffrey Hinton argued that we should stop training radiologists entirely. He thought it was completely obvious that AI would replace them — reading an X-ray is pure pattern-spotting, which is what computers are best at.
My son broke his arm a couple of weeks ago. AI did not read the X-ray. In fact, the number of radiologists has risen since Hinton declared radiology dead. Reading the X-ray turns out to be part of a bundle. Radiologists also talk to specialists, talk to patients, and handle special cases, all crucial parts of practicing medicine.
The strongest forecast anyone made turned out to be exactly wrong.
The last wrinkle
AI may be doing something else we don’t see in this data. It could be kicking away the first rungs of the career ladder. Jobs that used to go to a 23-year-old research assistant now may be going to Claude. That’s great for productivity: instead of one assistant, a senior researcher can have ten Claudes. But it’s bad for the young people who would previously have taken that job. They were trying to gain experience and build intuition and judgment — which AI doesn’t have. Job growth amongst young college graduates has fallen pretty dramatically.
The economy has settled into what folks call a low-hire, low-fire environment. And this is another factor that might really be hurting young people. After all, if no one’s hiring, that’s got to be hitting folks at the start of their careers. Point is, it’s hard to distinguish the effects of AI from an overall slowdown of hiring.
So the honest answer here is we only have hints about how AI is already reshaping work. The uncertainty each of us faces about the future of our careers is far bigger than anything in the September jobs report.
And if the evidence changes, I’ll revise my answer. That’s what good statisticians do.
And one more word for my nerdiest Platypals
Today’s post includes a paid partnership with Stata, the software I use to crunch the numbers in my posts (and my research).
I used it here to do my own calculations on the jobs report. And if you’re really nerdy, you can use this worksheet to follow along! Basically, I want to show you how you can do an insta-analysis of the jobs numbers before FRED has updated its numbers. Or if you’re an economics or econometrics instructor, you might find this useful for class.