


Every couple of weeks, someone on cable TV sits me down, points a camera at me, and asks the exact same thing. Our economic statistics look pretty good, so why are Americans so gloomy?
It’s a good question. Earlier this year, consumer sentiment hit an all-time low. It’s bounced around since then, but it’s still sitting at the sort of level you’d expect from a serious economic crisis.
The following comparison makes the point.
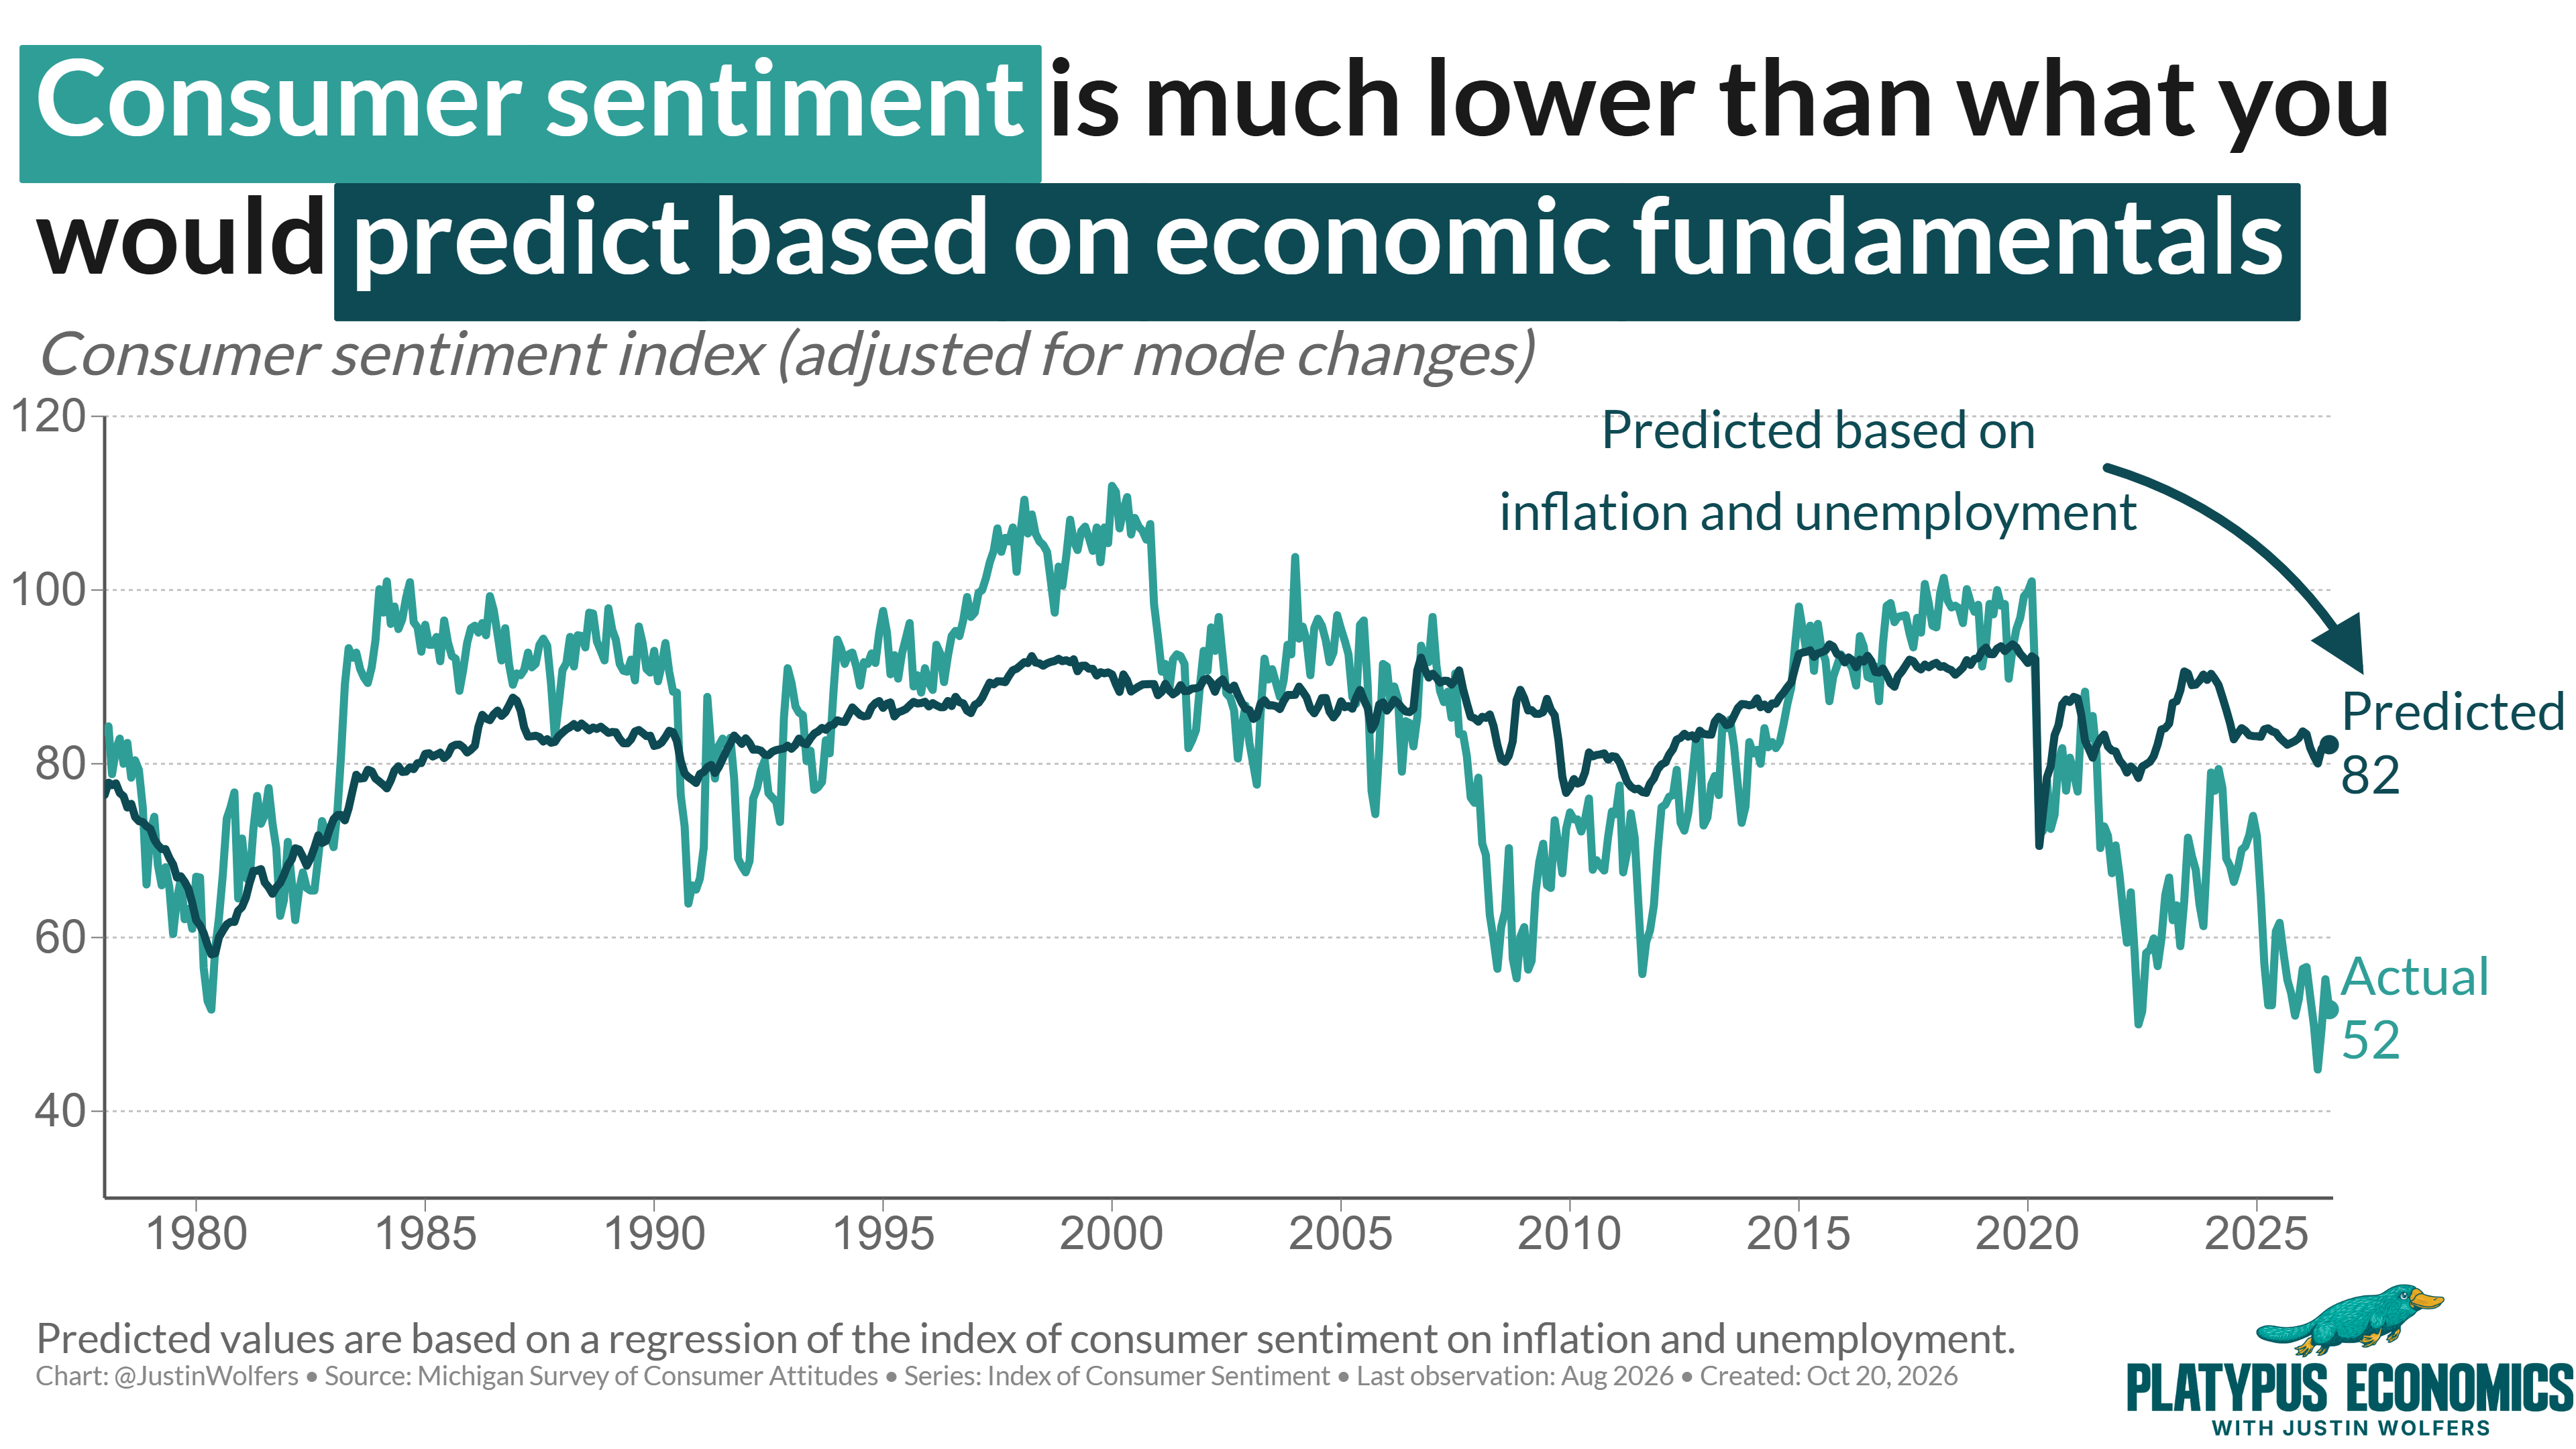
In May of 1980, the University of Michigan’s index of consumer sentiment sat at almost 52. This summer — 2026 — that same survey put consumer sentiment at just around 52. So, nearly identical levels of pessimism. The difference is, in 1980, unemployment was at nearly 8%. Today it’s about half that. Then, inflation was running around 14%. Today, it’s roughly a quarter of that.
This is a longstanding mystery that I’m hoping to solve. My prime suspect: An overwhelming majority of Americans rate economic policy under Trump as poor — the worst it has ever been — and they worry what this means for their economic futures.
Here’s the evidence.
First clue: open the survey
My colleagues at the University of Michigan who conduct the consumer sentiment survey ask five questions about how people feel about financial conditions. Most of these questions aren’t just about the present. They ask people to look ahead.
For half a century, if you were trying to understand swings in consumer sentiment, you could often explain them by looking at the economy. Sentiment tended to be low when prices rose too fast, or when work was too hard to find.
To quantify that relationship, I used straightforward statistical techniques (linear regression!) to estimate how these data had historically risen and fallen together. That allowed me to ask: Given the inflation rate and the unemployment rate, where would you predict consumer sentiment should normally be at a time like this?
For the summer of 2026, based on actual economic indicators, that model says consumer sentiment should be at about 82.
The actual number is 52.
That’s a 30-point gap, and it’s the mystery we have on our hands today. The usual economic indicators simply can’t explain that gap.
Our prime suspect
That same Michigan survey asks one more question that got me really interested. It asks folks how they evaluate the job the government is doing on economic policy. You can see why this might matter: If policy is good, you might be optimistic about your economic future. If it’s bad, you’re likely more pessimistic.
I’m going to call that answer America’s confidence in our economic managers. To turn it into a single number, take the share of people who say the government is doing a poor job and subtract the share who say it’s doing a good job. When that number rises, it means Americans are handing down a harsher verdict.
In late 2024, the verdict stood at +14. That means 14 percentage points more Americans thought the government was doing a poor job than a good one.
By May 2026, it had hit +66.
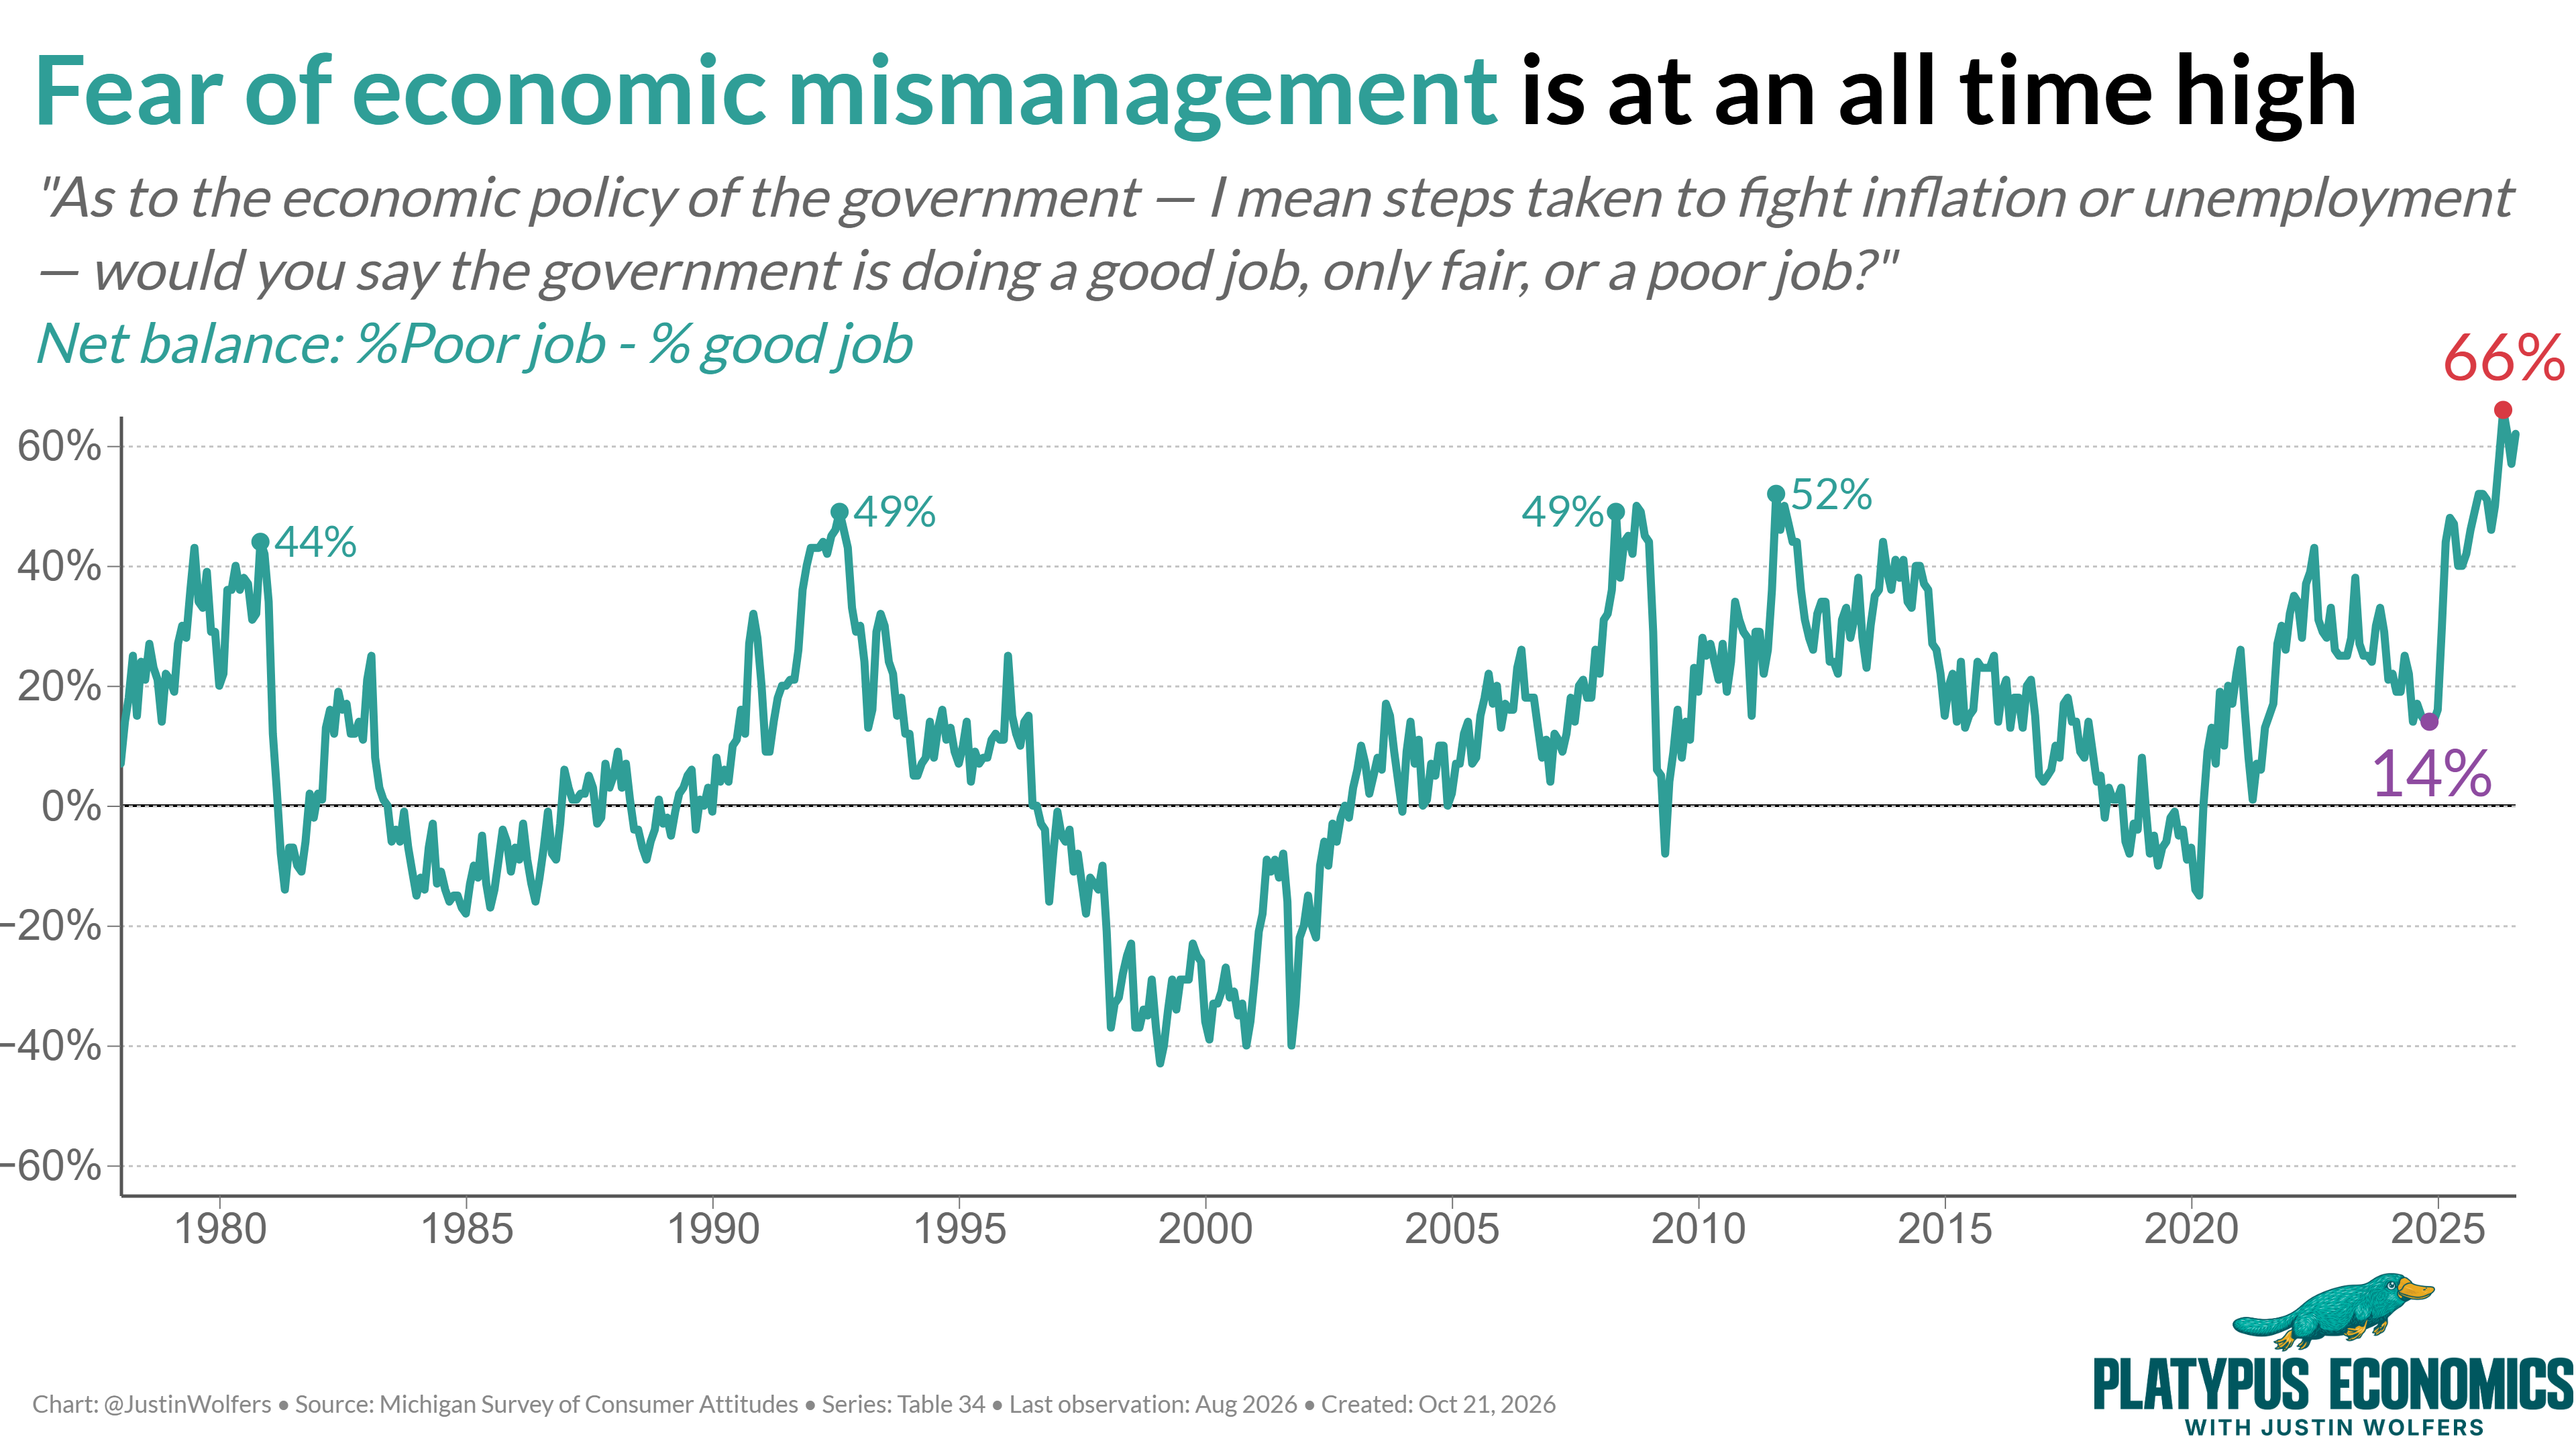
That’s the highest reading in the history of the question (by a lot). The previous record was +52 and it was set during the 2011 debt ceiling crisis. At that point, Congress was flirting with the idea of not paying the nation’s bills. We’re now 14 points worse than we were then.
Now for some detective work. I took the history of consumer sentiment, and I stripped out the ups and downs that are explained by the usual suspects of unemployment and inflation. What’s left is the mystery we’re trying to solve: those movements in sentiment that are not explained by actual economic conditions.
Then I plotted America’s verdict on the quality of our economic leadership next to it.
The two move together. And they move together remarkably closely.
The clearest way to see that is a scatterplot (my favorite kind of plot!). Every dot is one month all the way back to 1978. The vertical axis shows the part of consumer sentiment that inflation and unemployment can’t explain. The horizontal axis shows the public’s verdict on our economic managers. I never imagined the fit would be so tight!
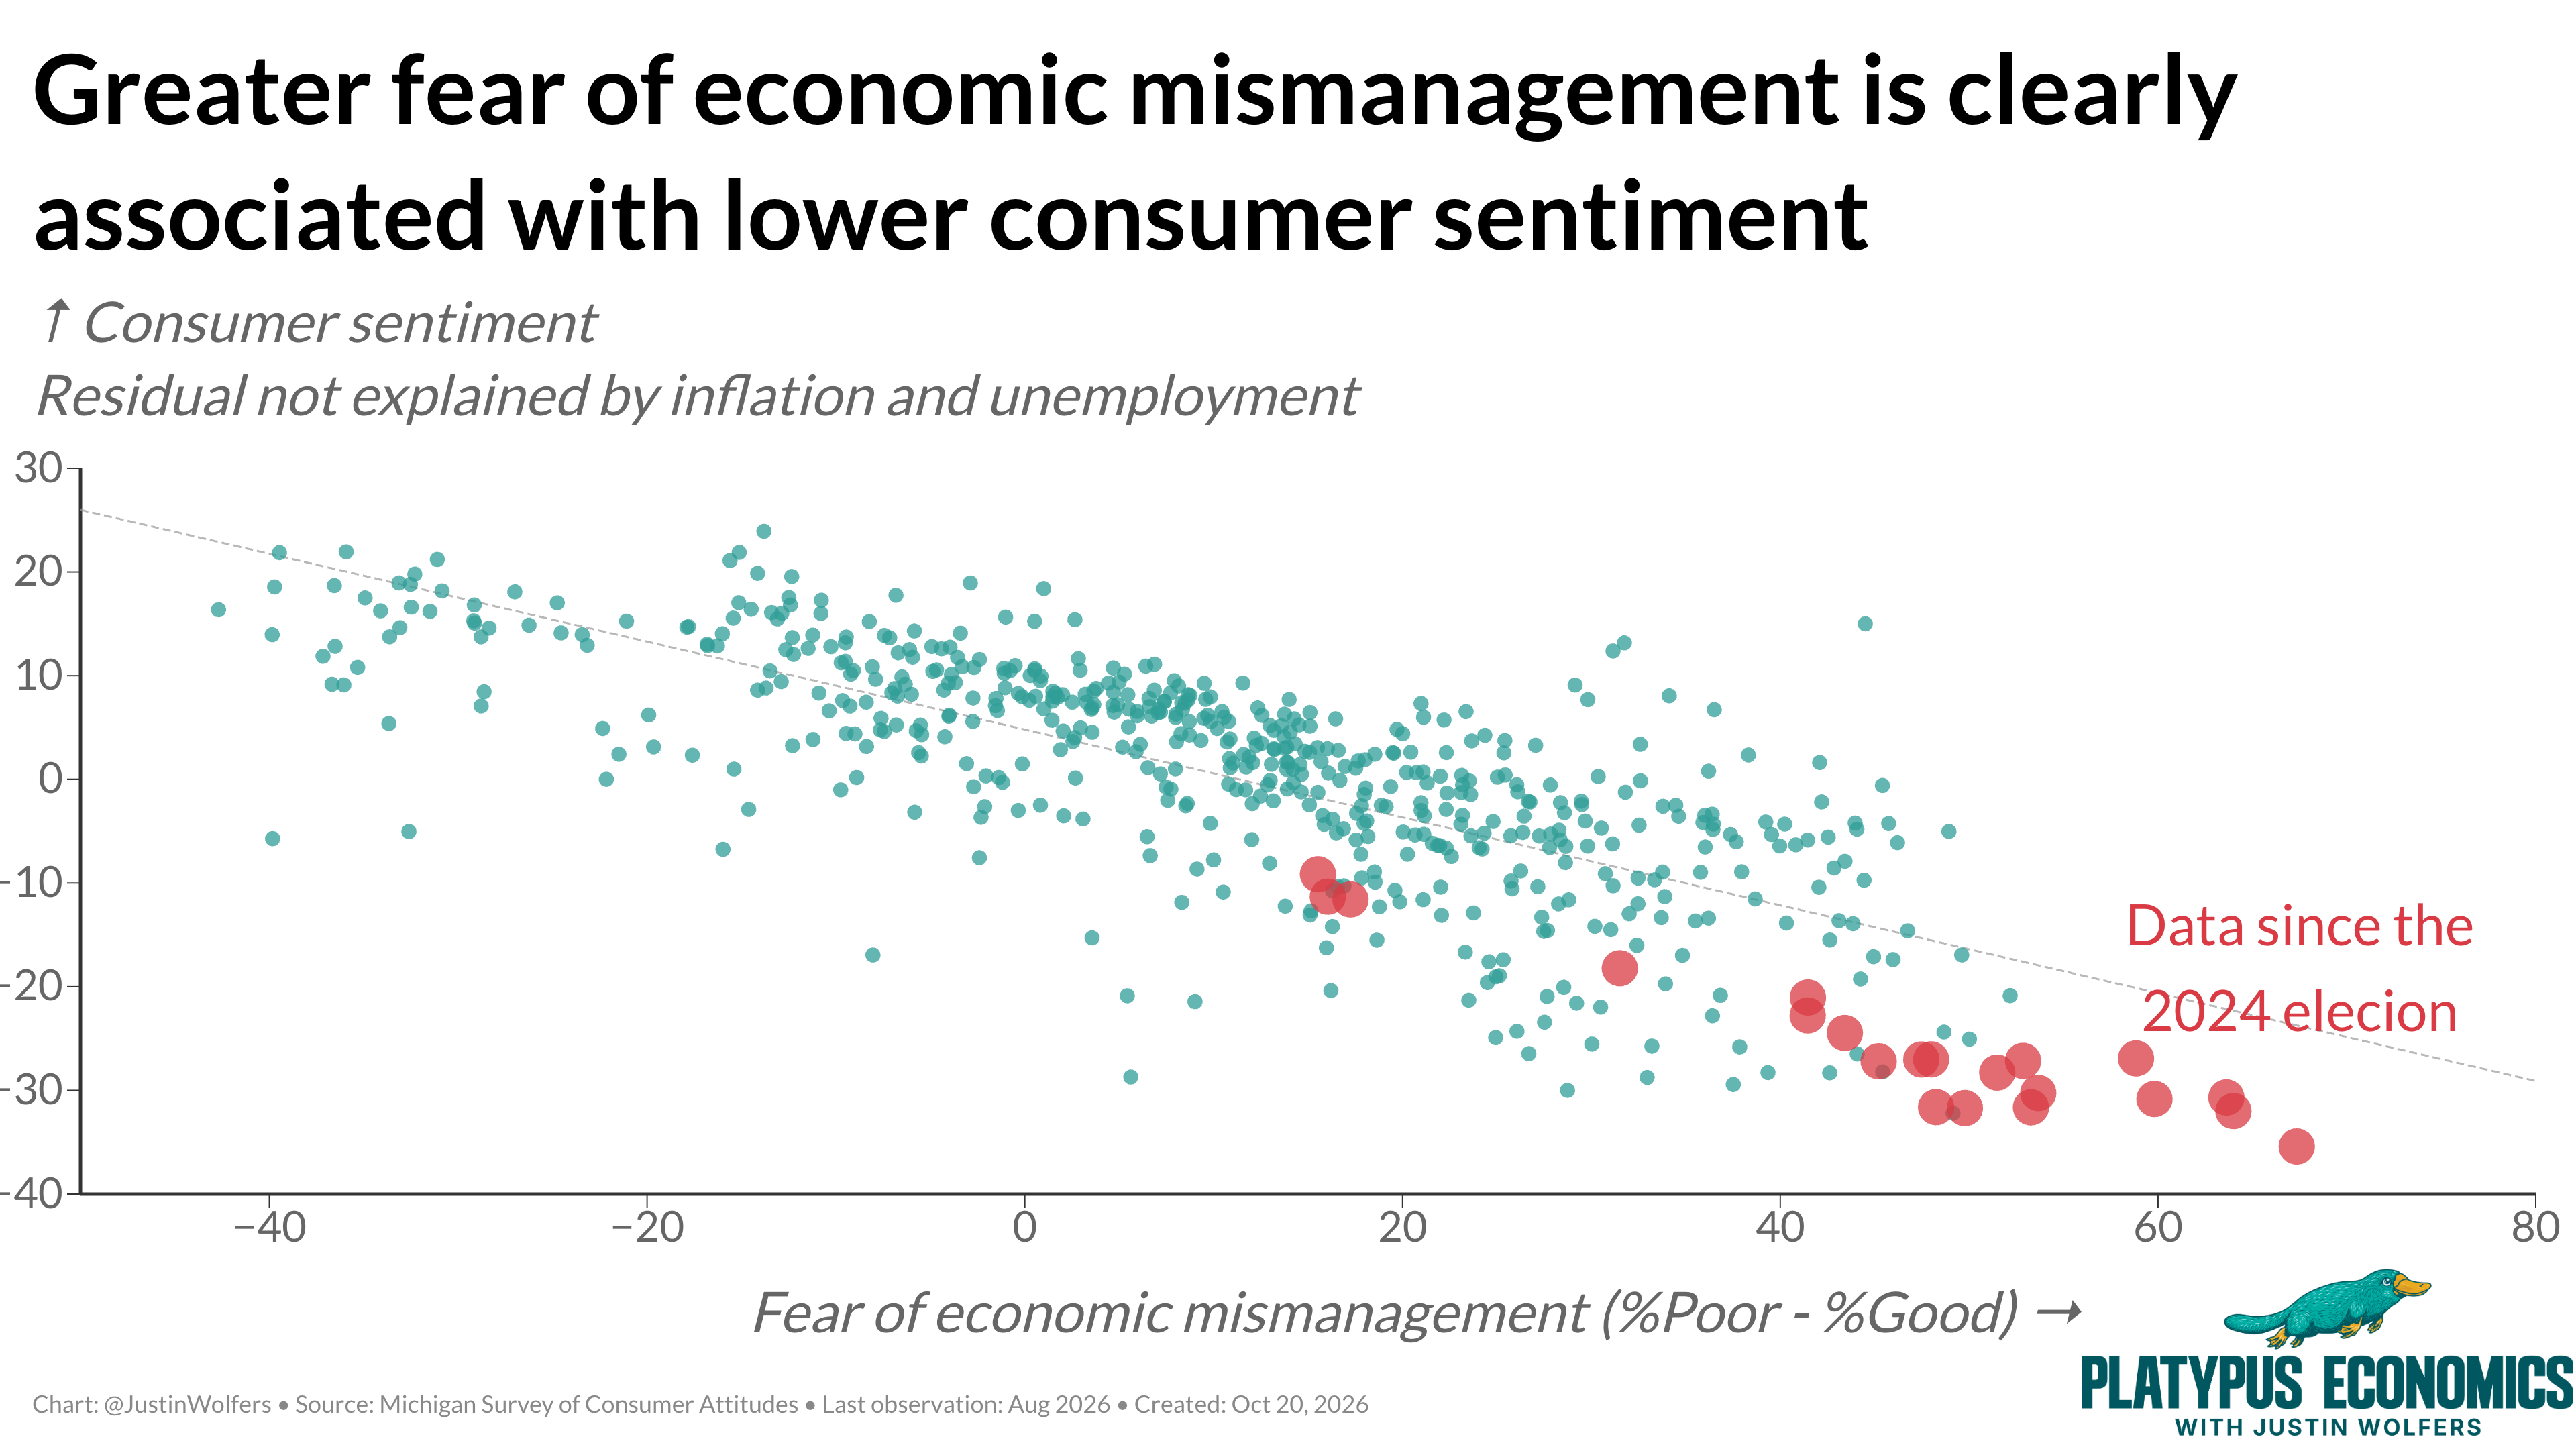
A 10-point worsening in the verdict goes with about a 4.5-point fall in consumer sentiment. This suggests that our feelings about economic policy are a powerful lever shifting consumer sentiment. (I’m not going to do the correlation-versus-causation dance here; I’m just trying to find a plausible suspect that fits the facts.)
The data we all lived through
The months since the 2024 election sit at the extreme end of that scatterplot for a reason. Our distrust of our economic managers has risen sharply, and it is at a record high. Even so, those dots land remarkably near the historical line of best fit. It follows that, given how badly Americans now rate the people running our economy, today’s sentiment is pretty much exactly what we’d expect.
Why the loss of faith? Rather than guessing, we can turn back to the survey for more details.
Michigan asks people, in their own words, what economic news they’ve heard recently. In 2025, the number of people voicing concerns and complaints about the government hit a record high. Tariffs dominated those answers. In 2026, those tariff mentions had faded in favor of complaints about high prices and gas.
People are taking all of this in and they’re putting it together. They arrive at this darker view of the economic future at the same time and in the same way as they arrive at a darker view of the people in charge.
Could we have seen this coming?
Now I’m going to do what economists do and urge us to be careful. A pattern that looks obvious after the fact might just be a good story that we invented once we knew the ending. A much tougher test: could this theory have predicted the collapse in sentiment before it happened?
I reckon it could have.
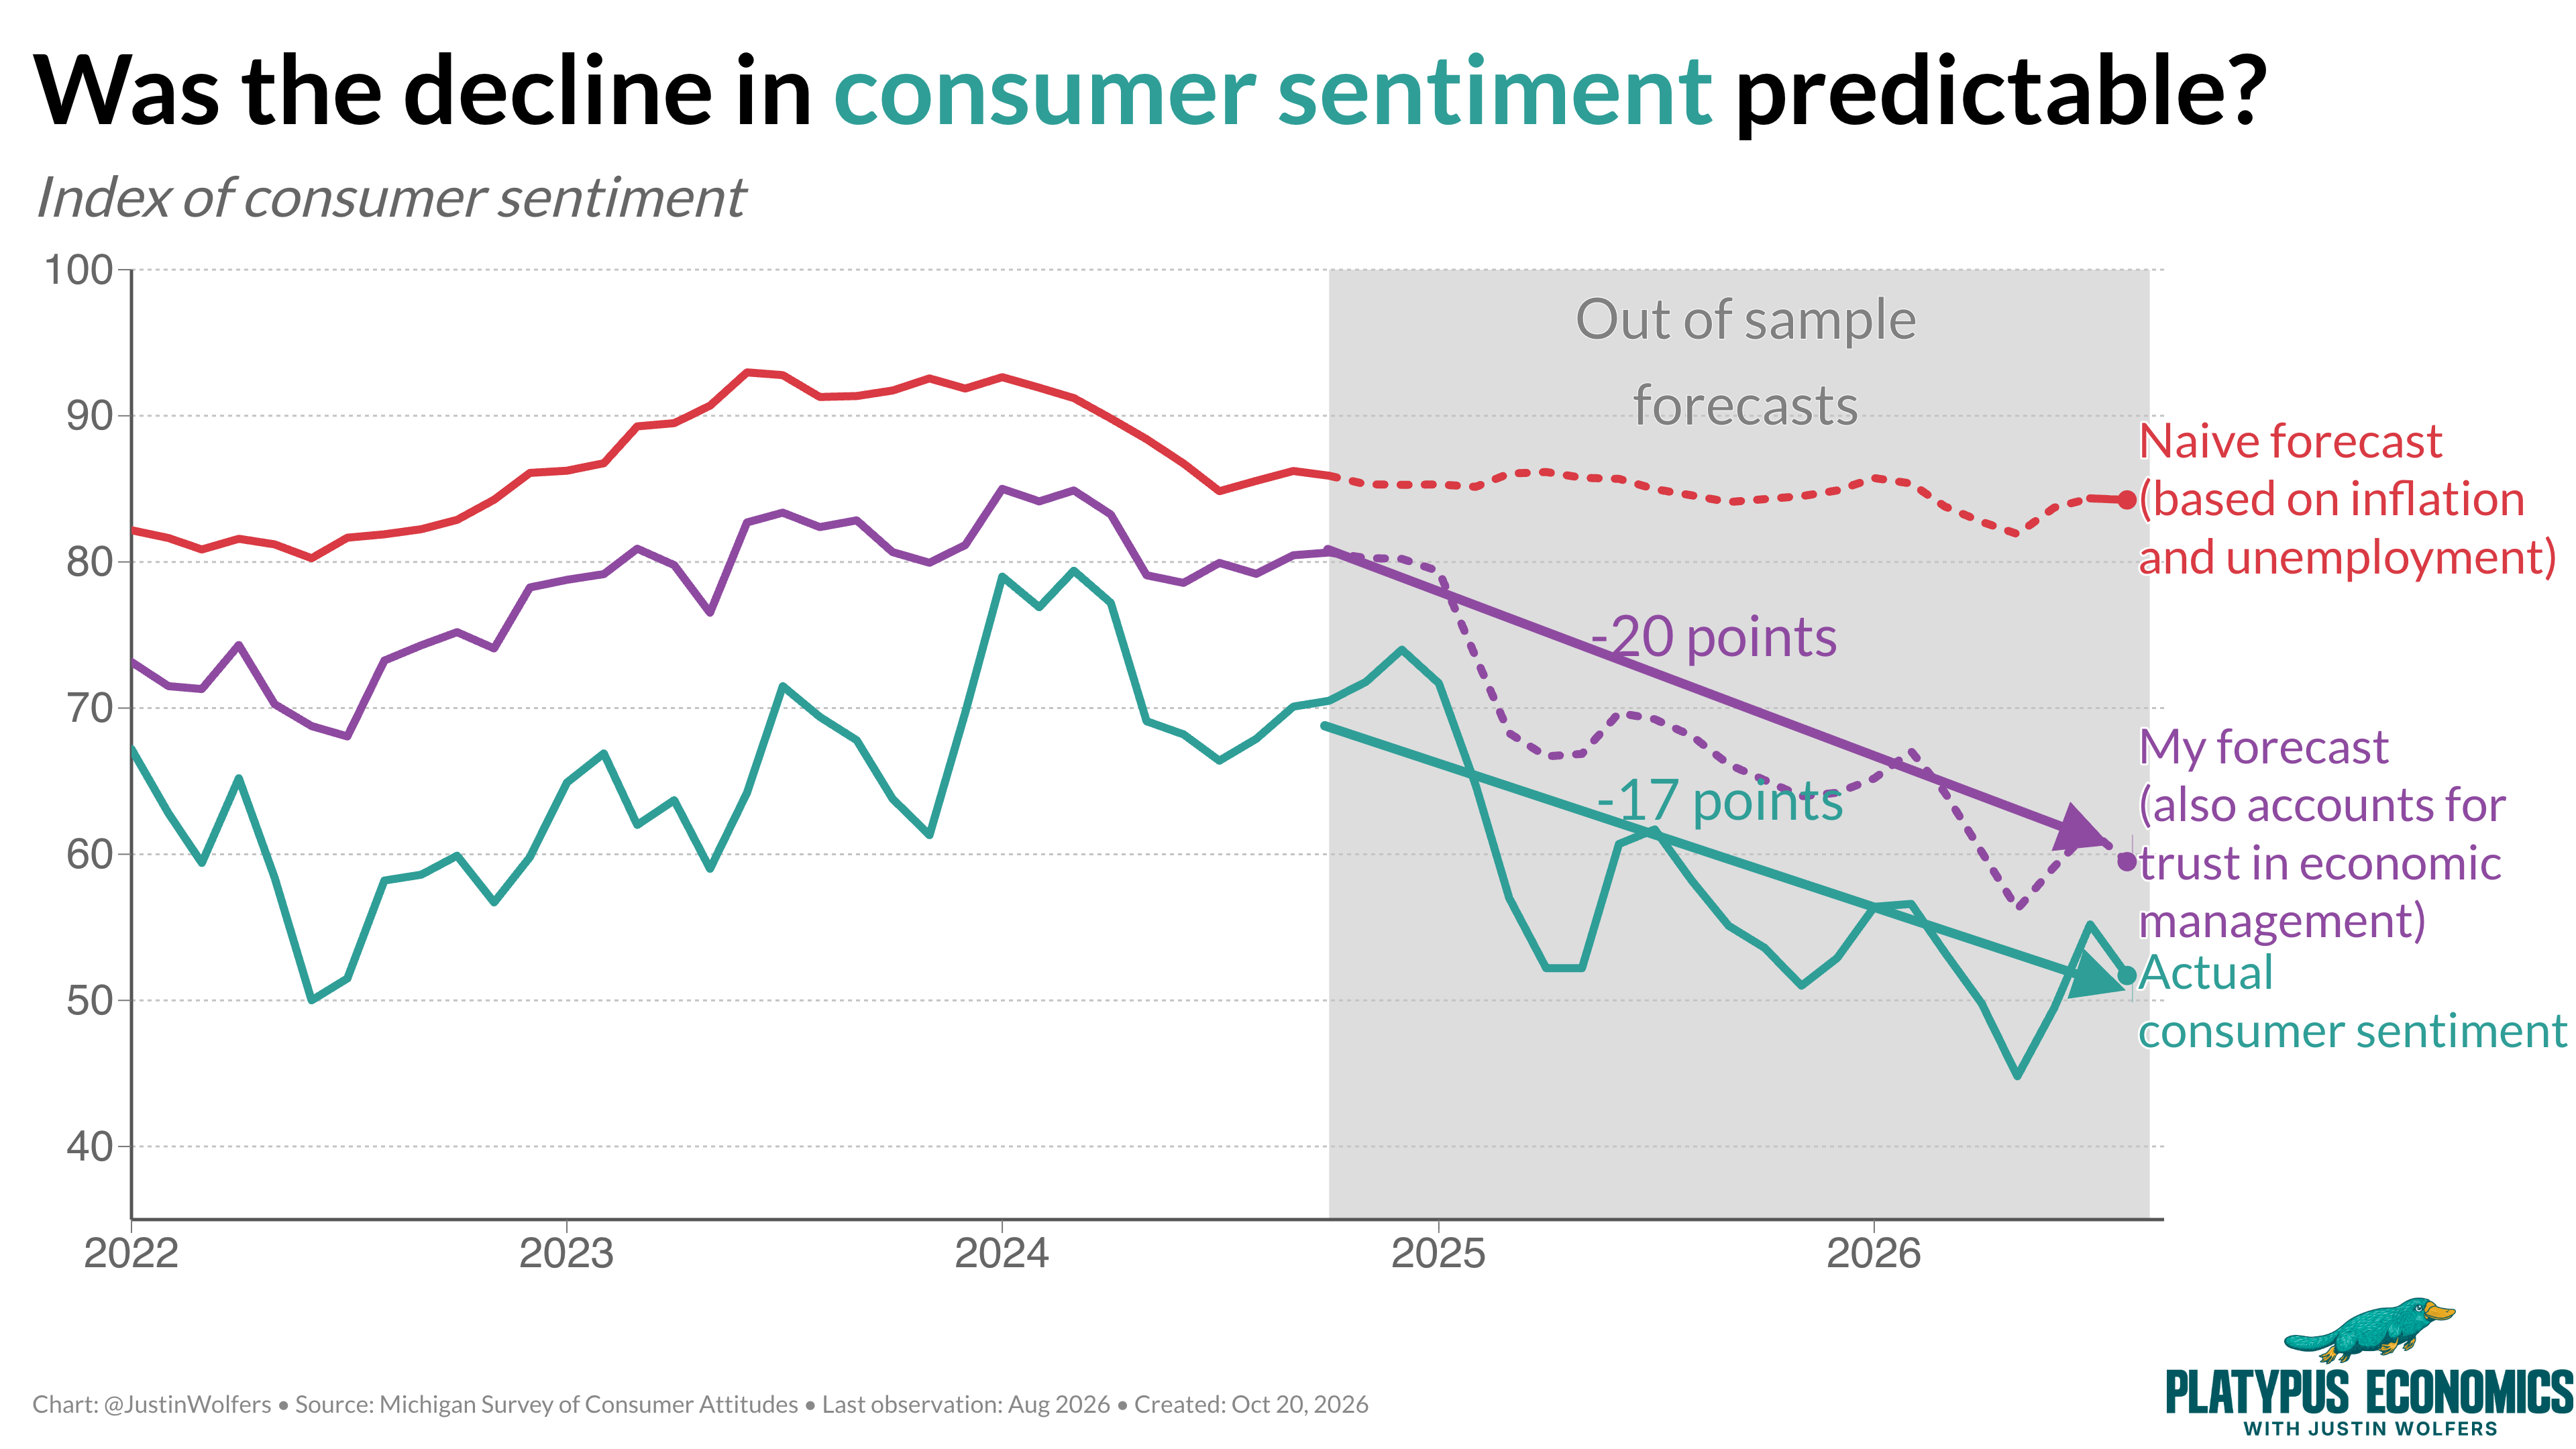
Here’s how I checked. I estimated how consumer sentiment typically moves with inflation and unemployment (the usual suspects) plus the public’s verdict on economic management (my additional factor). I used only data through October 2024. So this model received 46 years of history, from high inflation and recessions to recoveries and triumphs. It saw presidents from both parties making all kinds of decisions. But, importantly, it didn’t see anything after the 2024 election.
Then I made two forecasts.
First: The naive one. I told the model what happened to inflation, and what happened to unemployment, and I asked it to predict sentiment. I even tried adding the stock market. It didn’t make much of a difference.
Between late 2024 and this summer, inflation rose by less than a percentage point and unemployment barely budged. This naive forecast said that sentiment should have fallen by about two points.
It actually fell by much more, by 17 points.
Second: Let’s make a forecast that also accounts for how Americans feel about the quality of economic policy. From 2024 to 2026, that verdict worsened by 45 points. If you feed that into the model, which still only has pre-election data, you get a very different picture. Here’s the arithmetic: 45 points of harsher verdict, times roughly 0.45 points of sentiment per point of verdict, predicts a decline of about 20 points.
In economics, we don’t call that a near miss. We call it nailing your forecast.
Looking for confessions from the usual suspects
To actually earn trust with this theory, we need to interrogate serious alternatives. If another explanation fits the facts better, we drop mine. So let’s try to destroy this finding.
Suspect one: partisanship. There’s good (and perhaps unsurprising) evidence that Democrats feel better with a Democrat in the White House, and the same pattern holds for Republicans.
So let’s look at people who don’t cheer for either team: independents. Since the election, independents have had about the same drop in confidence in America’s economic leadership as everyone else. Alongside that confidence drop, their sentiment has fallen. And the pre-election relationship model predicts that change almost perfectly.
Republicans offer a smaller but still useful piece of corroboration. After the election, their optimism surged, with their guy in the White House and their party running both chambers of Congress. But over the past year (and especially through 2026) they’ve soured on the administration’s economic management. Republicans’ verdict has worsened somewhat less than everyone else’s, and with that, their sentiment hasn’t fallen as far. That’s exactly what the theory predicts.
Suspect two: bad vibes. Maybe everyone is just in a foul mood, so they think the government is doing a terrible job.
The data rule this out too.
The public’s verdict is a very helpful tool. It sharply improves our ability to explain views about national business conditions over the next five years. It also gives us insight into expectations about real incomes. But it doesn’t explain expectations for interest rates or people’s ability to buy a house. So, this isn’t just a fog of grumpiness. It’s directly tied to a broad sense of where things are headed — not just to judgements about particular markets.
Suspect three: the survey changed. My colleagues at Michigan used to conduct this survey via phone, but nobody answers the phone anymore. So they switched to surveying folks online. People surveyed online tend to be more pessimistic, and so I adjust for that difference throughout.
More importantly, both ends of the decline I’m explaining were measured online. The switch happened before the election. So it can’t explain why sentiment fell so dramatically at exactly the moment distrust in management soared.
One more cautious note. Prices are still well above where they were pre-pandemic, and living costs are high. I think those forces explain a different puzzle: why sentiment has been weak since 2020, under both a Republican and a Democratic president.
My claim here is narrower than that. Americans’ verdict on economic management explains a huge chunk of the falling sentiment over the past year and a half.
Is that the whole story? I’m not sure. If you’ve got a better one — a different suspect, something I missed in the data — leave a comment below. I mean it. I’m always happy to run the numbers.
A suspect caught at the scene
This leaves us with a very likely suspect. But it also gives us a hint that economists need to add something when we talk about the business cycle. Textbooks teach monetary policy and fiscal policy, which means taxes, spending, interest rates: the levers government pulls to shape economic life. But there’s another part of the story.
That part is whether people think the folks pulling levers know what they’re doing.
So the next time someone points a camera at me and asks why Americans are so gloomy when the numbers look fine, here’s my answer. They’re not misreading the economy. They’re reading the people running it. And their verdict today is the harshest on record.
And one more word for my nerdiest Platypals
Today’s post includes a paid partnership with Stata, the software I use to crunch the numbers in my posts (and my research).
I used it here to do my own calculations on consumer sentiment. And if you’re really nerdy, you can use this worksheet to follow along! Or if you’re an economics or econometrics instructor, you might find this useful for class.
Outstanding analysis, clearly explained. Thanks. The only major factor I can think of is the correlation of national debt level (that gets so much press) and consumer confidence. It has to have an influence on people's confidence albeit an indirect measure.
I never paid attention to economics per se until you came along. Not only is it interesting, but I get it! All thanks to you and your outstanding ability to explain things to non-economics people. You are one of our national treasures (yes, we’re claiming you even though you’re Australian) and voices of reason in these turbulent times. Thanks!